The LED (far-field) type Source Primitive allows for representation of a Light Emitting Diode (LED) using customized spectral power distribution and intensity distribution (azimuthally symmetric). A spatially uniform exitance (and color) at the source aperture is assumed and, therefore, does not guarantee an accurate radiance model in the near field of the emitter. Intensity and spectral profiles for LEDs are commonly available through the vendor website or part specification sheets. These data can be used in a LED (far-field) model using the procedures referenced in the Application Notes section.
This feature can be accessed in the following ways: •Menu > Create > Source Primitive > LED (far-field) •Right mouse click on the Optical Sources folder, select Create New Source Primitive > LED (far-field) •Toolbar button:
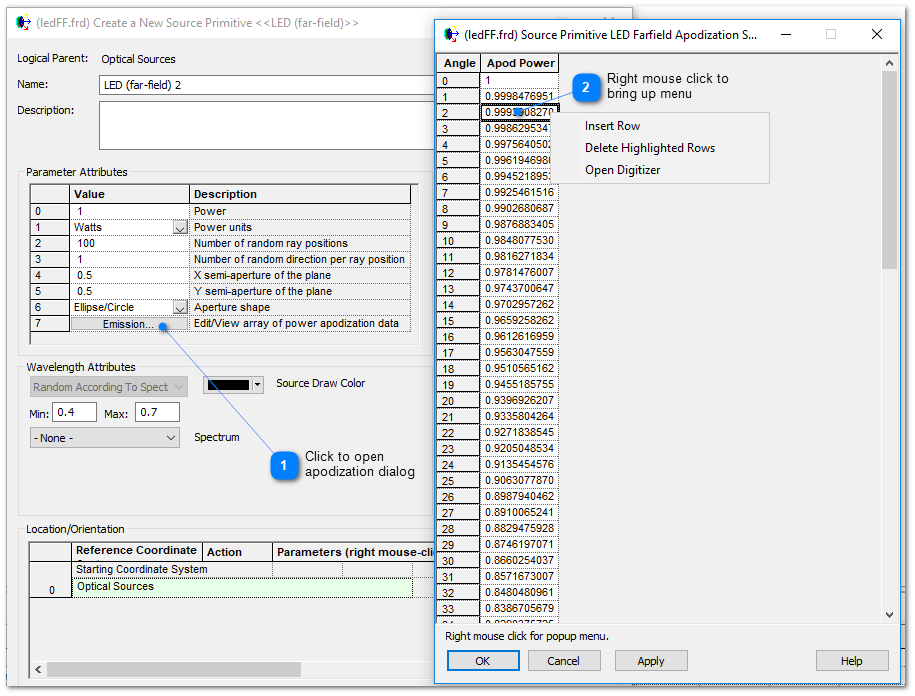
Parameter 6 in the LED (far-field) dialog contains a button labeled "Emission" that, when pressed, opens a two-column dialog of sampled data that is used to specify the relative angular emission profile of the source rays (i.e. how power is emitted by the source as a function of angle). Right mouse clicking in the resulting spreadsheet interface will bring up a context menu with options for editing the apodization table. •Multiple rows can be selected by left mouse clicking in the Angle column and dragging the mouse down through the table •The Angle values can be edited by selecting the value in the gray cell and entering a new value •Values can be appended onto the end of the table by simply typing in the first empty cell at the end of the table
The apodization table can be fully populated using FRED's Digitizer utility, which is an option available on the right mouse-click menu within the sampled data table as shown above. The procedure for using the Digitizer to populate the apodization table is the following:
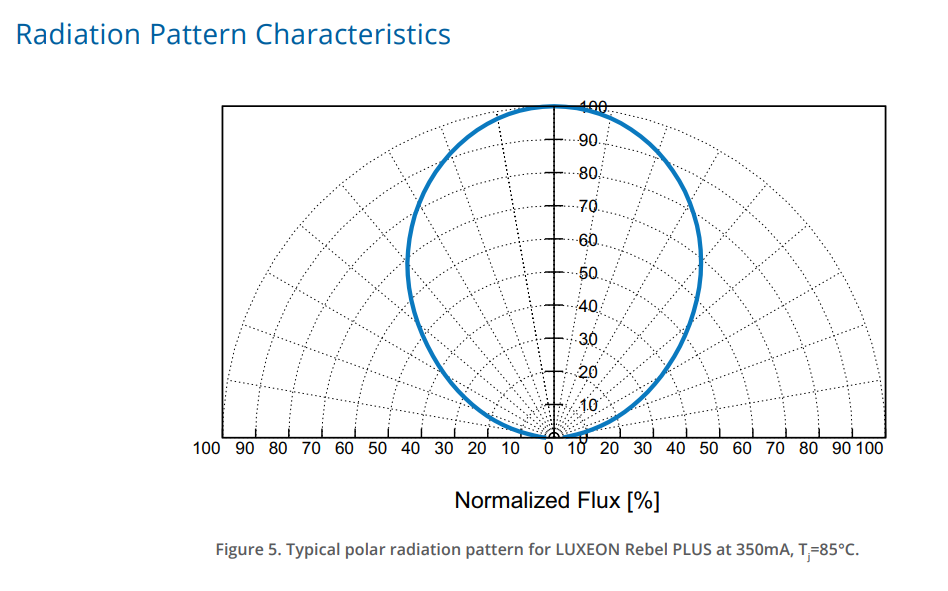
1.Retrieve the source specification document from the vendor, which should contain a "radiation pattern" or intensity profile plot. Use a screen capture tool to save this plot as an image file. Shown below is a polar radiation plot extracted from the specification document for a LUXEON Rebel PLUS LED.
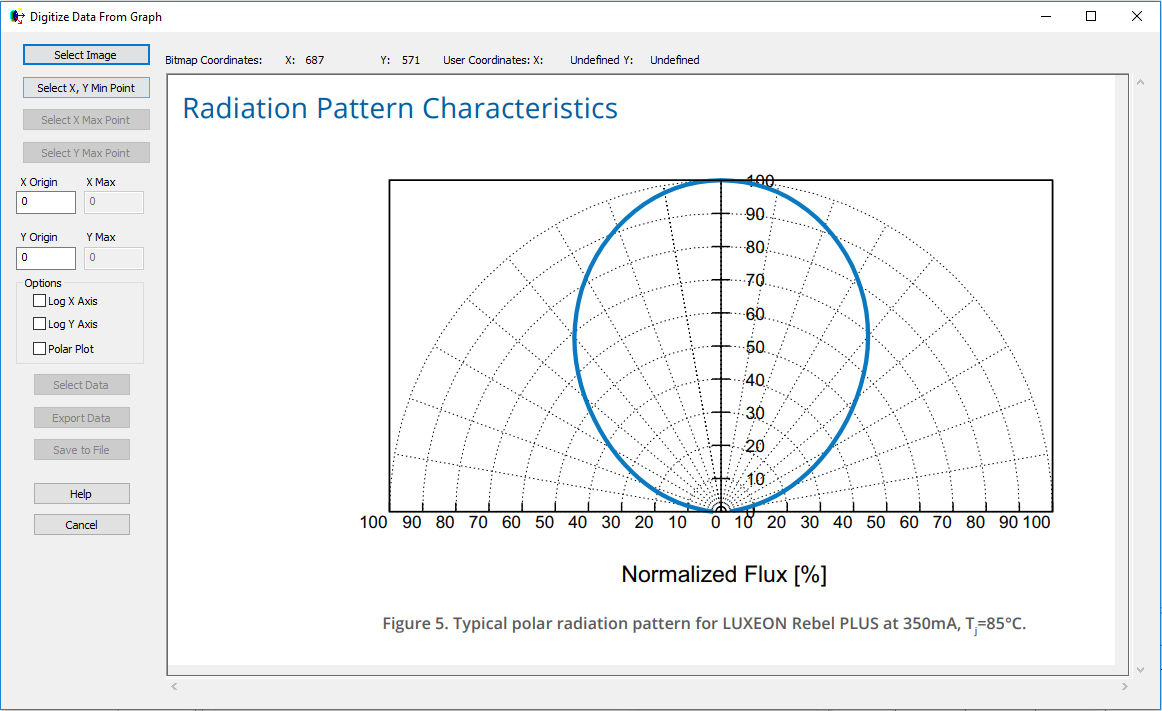
2.In the LED (far-field) source dialog, press the Emission button to open the apodization data table. Right mouse click in the data table and select, "Open Digitizer" to open the Digitizer tool. 3.On the top left of the dialog, press Select Image and then choose the bitmap image of the polar radiation pattern saved in Step 1. The bitmap will be loaded into the Digitizer.
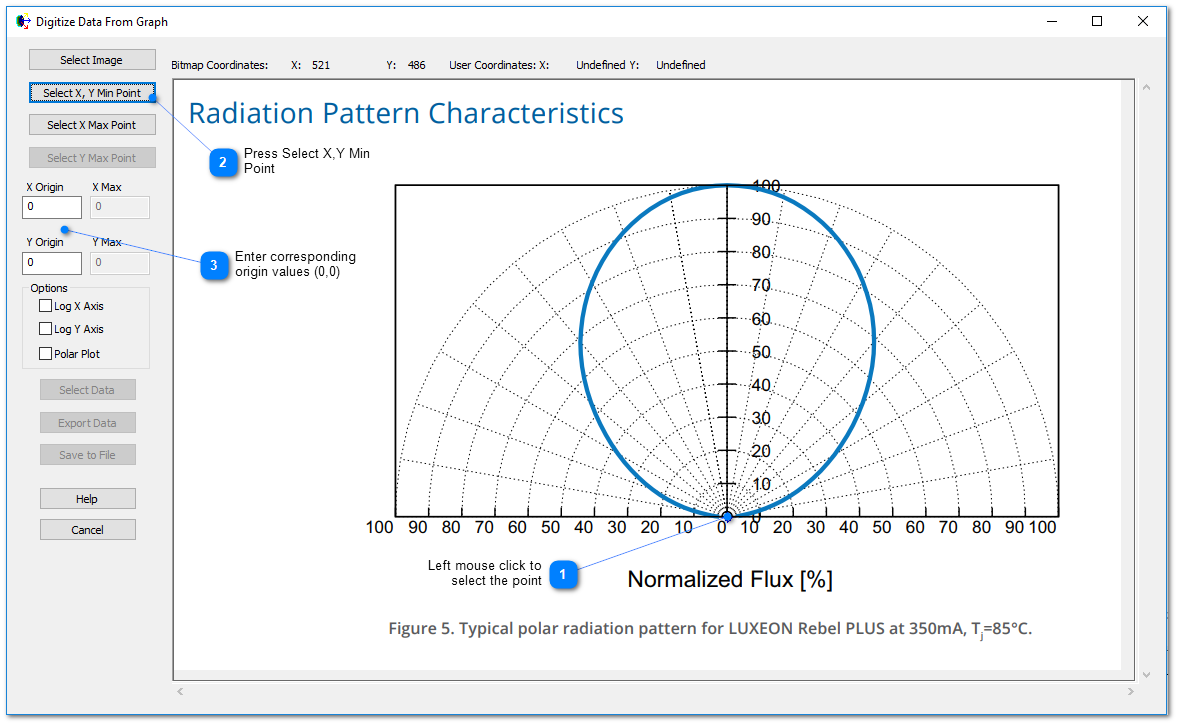
4.Press the "Select X,Y Min Point" button and then left mouse click on the (0,0) origin point of the plot. A crosshair marker will be placed onto the plot, indicating the selected point. On the left hand side of the Digitizer dialog, the X Origin and Y Origin values corresponding to the selected point are both set to 0.
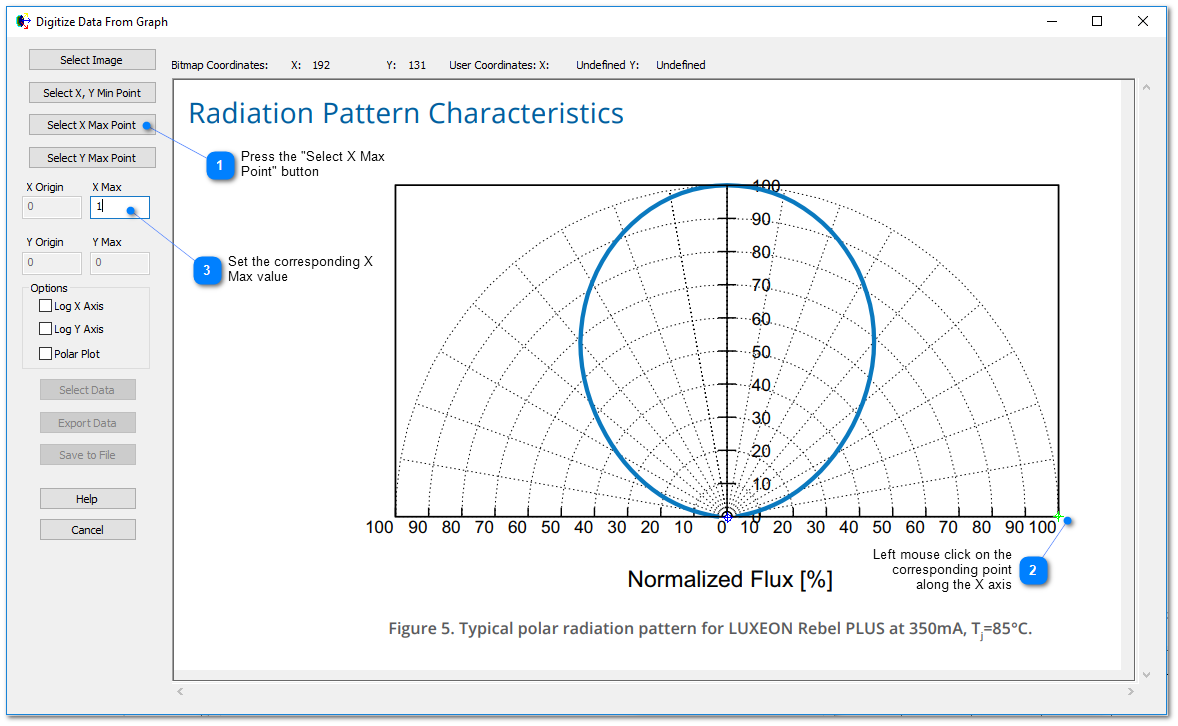
5.Press the "Select X Max Point" button and then left mouse click at the 100% intensity point along the X axis. A crosshair marker will be placed onto the plot, indicating the selected point. On the left hand side of the Digitizer dialog, set the X Max value to 1.0.
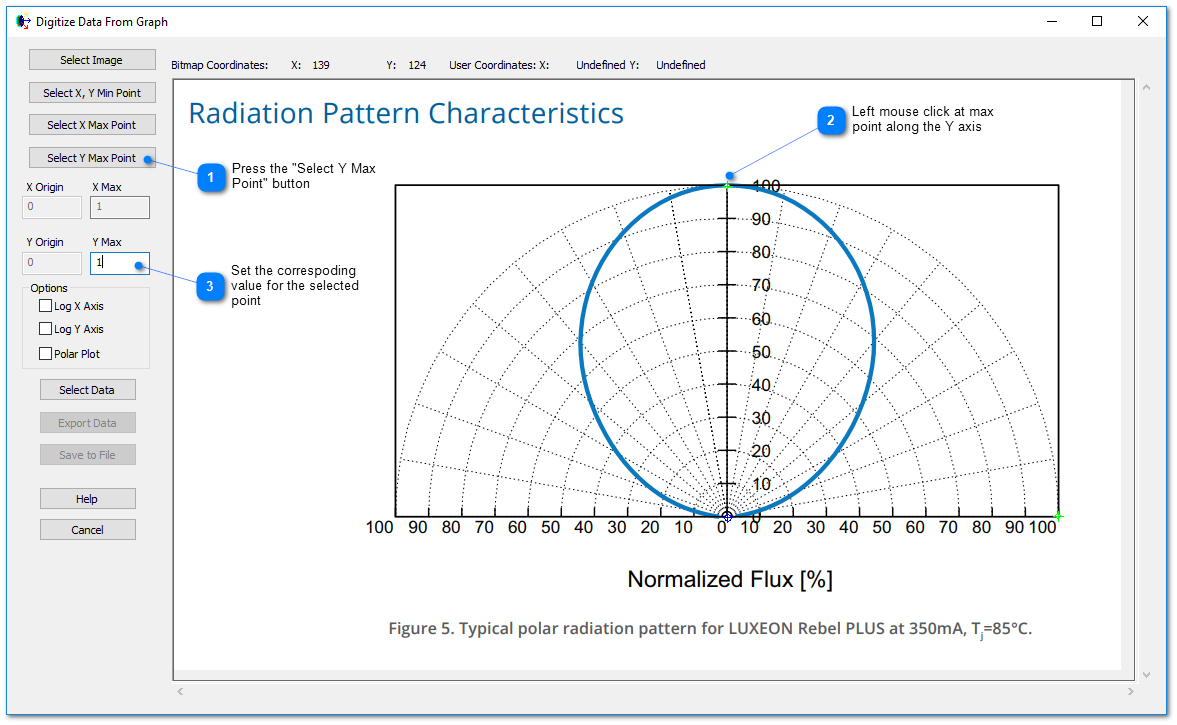
6.Press the "Select Y Max Point" button and then left mouse click at the 100% intensity point along the Y axis. A crosshair marker will be placed onto the plot, indicating the selected point. On the left hand side of the Digitizer dialog, set the Y Max value to 1.0.
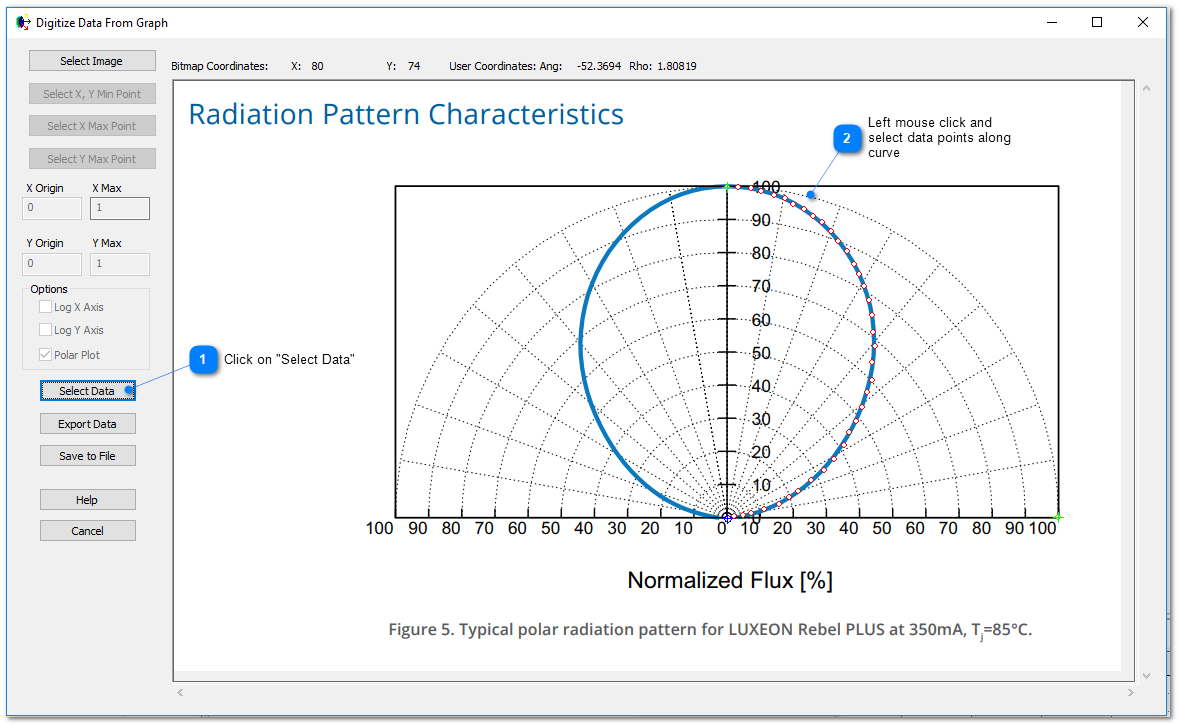
7.Toggle the "Polar Plot" option on the left hand side of the Digitizer dialog 8.Click on the Select Data button on the left hand side of the dialog. Starting at polar angle 0o (along the Y axis of the plot) and working your way along the curve, left mouse click to select data points (you can also right mouse click on a point to remove it from the dataset). The LED (far-field) model assumes azimuthal symmetry, so only one half of the radiation pattern needs to be digitized.
9.Click on "Export Data" to send the digitized data points back to the apodization table dialog.
|
||||||||||||||||||||||||||||||||||||||||||||||||||||||||||||||||||||||||||||||||||||