|
Description
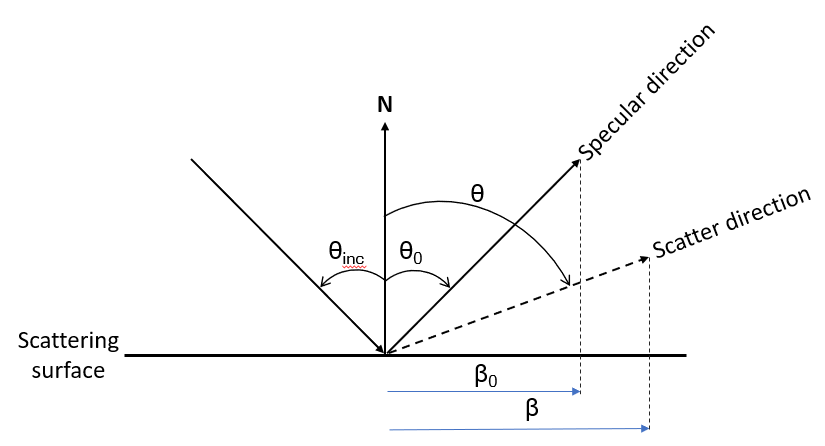
The in-plane BSDF profile of a scatter model can be plotted in a variety of forms, each of which may insights into the scattering behavior. For discussions that follow, we use the following quantities:
|
θ0
|
Angle between the surface normal and the specular direction
|
|
θ
|
Angle between the surface normal and the scatter direction
|
|
β0
|
Sin(θ0)
|
|
β
|
Sin(θ)
|
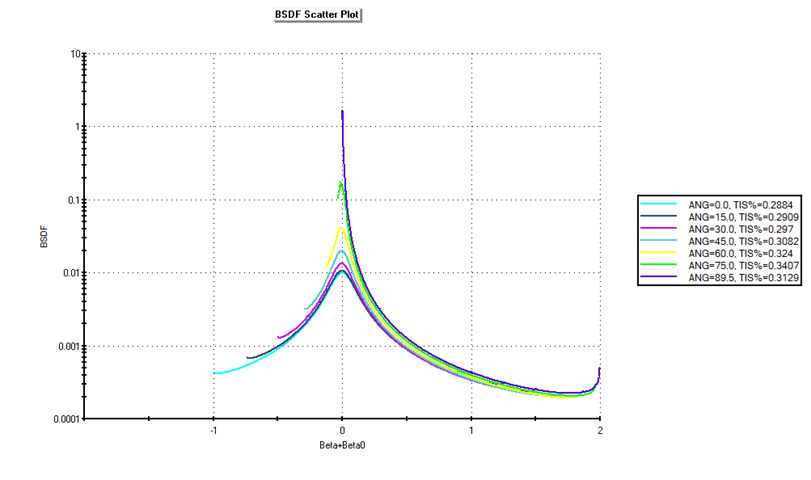
Each of the 2D plot types show the in-plane BSDF behavior for a series of 7 incident angles (0o, 15o, 30o, 45o, 60o, 75o and 89.5o). The angles are not user-specified. The legend indicates the corresponding incident angle for each BSDF series as well as its total integrated scatter (TIS).
|
Plot Type
|
Plot Example
|
|
2D (Angle) linear
Vertical axis shows log10(BSDF) and horizontal axis shows the scattering angle in degrees.
This plot type displays the BSDF behavior in an intuitive manner that tends to emphasize details at larger scatter angles relative to the surface normal when compared to the (Beta) linear plot (below).
|
.png)
|
|
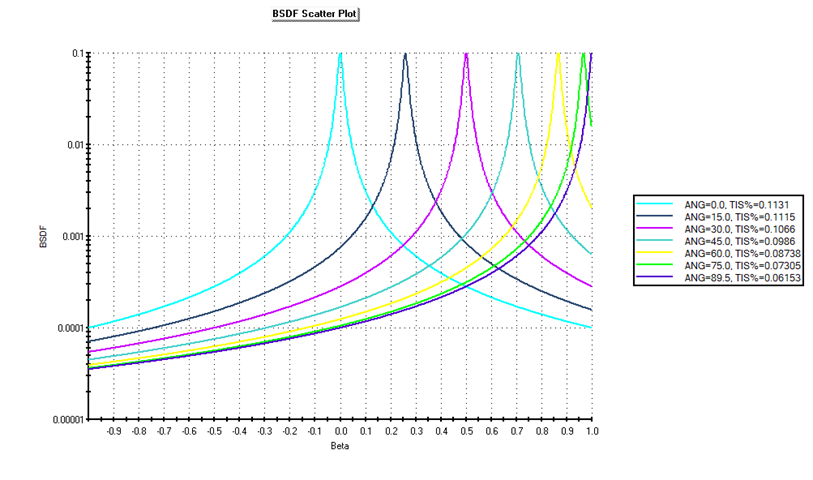
2D (Beta) linear
Vertical axis shows log10(BSDF) and horizontal axis shows β.
This plot type is similar to the 2D (Angle) linear plot except that the β axis will tend to emphasize details at small scatter angles relative to the surface normal when compared to the (Angle) linear plot.
|
|
|
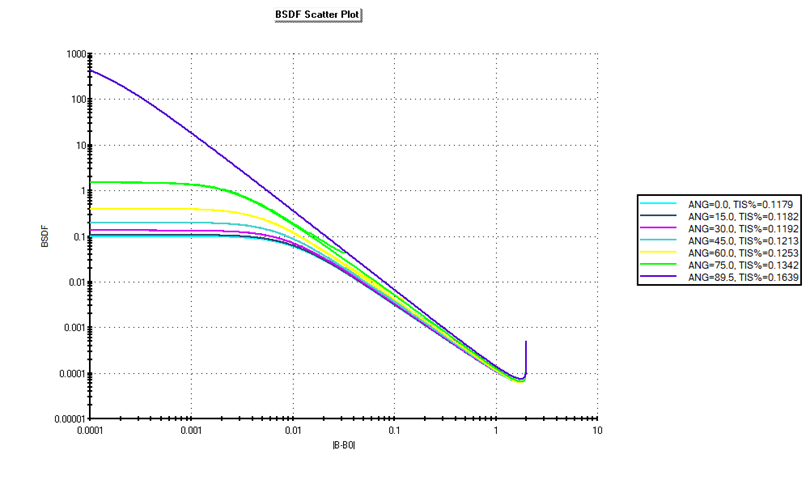
2D (Beta – Beta0) logarithmic
Vertical axis shows log10(BSDF) and horizontal axis shows log10|β – β0|.
This plot type is useful for BSDF that exhibit a “peak” around the specular direction (i.e. polished surfaces or treatments that have a “gloss” component) and will emphasize the near-specular behavior. As you move to the left on the |β – β0| axis you move towards the specular direction. As you move to the right on the |β – β0| axis you move away from the specular direction.
The sample plot to the right shows that the peak BSDF value in the specular direction is increasing with larger angles of incidence on the scattering surface.
|
|
|
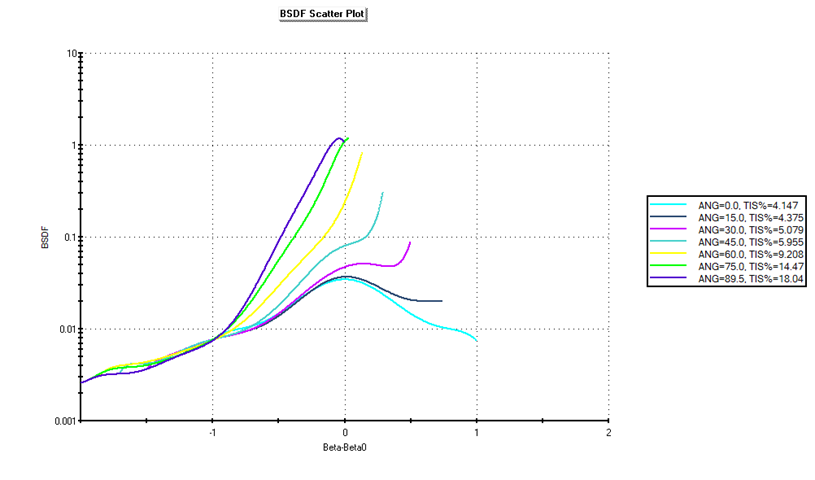
2D (Beta – Beta0) linear
Vertical axis shows log10(BSDF) and horizontal axis shows (β – β0).
This is a shifted form of the (Beta) linear plot, where each BSDF series is centered on its specular direction at (β – β0) = 0. Values of (β – β0) < 0 are “backscatter” and (β – β0) > 0 are “forward scatter”.
|
|
|
2D (Beta + Beta0) linear
Vertical axis shows log10(BSDF) and horizontal axis shows (β + β0).
This is a shifted form of the (Beta) linear plot, where each BSDF series is centered on its specular direction at (β + β0) = 0. While not common, this form may be observed in scattering surfaces with a strong volume or subsurface component that results in a retro-like behavior.
|
|
Navigation
This feature can be accessed in the following way:
|
1.
|
|
Select a scatter model (or multiple scatter models) and then right mouse click to bring up the context menu.
|
|
2.
|
|
Select one of the following options from the context menu:
|
|
|
•
|
Plot Scatter 2D (Angle) linear
|
|
|
•
|
Plot Scatter 2D (Beta) linear
|
|
|
•
|
Plot Scatter 2D (Beta – Beta0) logarithmic
|
|
|
•
|
Plot Scatter 2D (Beta – Beta0) linear
|
|
|
•
|
Plot Scatter 2D (Beta + Beta0) linear
|
Related Topics
Plot 3D
Chart viewer - Save Dataset
Chart viewer - Chart settings
|
Copyright © Photon Engineering, LLC
|
|