This command will save chart data to a text file. The file format of the saved data is explained below in the Application Notes section of this help topic. Saving chart data to a text file can be useful when combining multiple datasets together through the GUI.
This feature can be accessed in the following ways:
The table below shows the controls used for saving chart data to a text file using the Advanced chart dialog option.
The format of the saved data for spread functions (irradiance, intensity, etc) is the same for incoherent or coherent sources and even for different spread function types. There is nothing in FRED that will bar you from combining any two data sets as long as they have the same grid dimensions. For example, you can combine an irradiance data set with an intensity data set even though one is in coordinate space and the other is in direction cosine space.
The number of divisions and the size of the grid in the X and Y directions are specified in the analysis surface using the X,Y Min/Max/Divisions entries on the analysis surface dialog box.
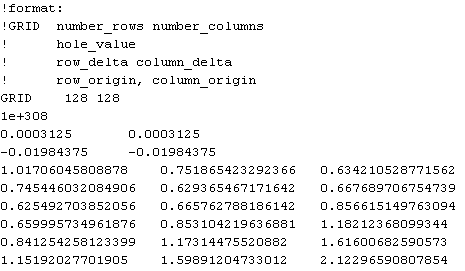
The image below shows an example of spread function data saved to file from the chart viewer. This file has the following line format: Lines 1-5: These lines describe the header format and are commented out with an "!" symbol Lines 6-9: The actual header values specifying the data format (Grid), number of rows and columns (128, 128), row and column spacings (0.0003125, 0.0003125) and the row and column origins (-0.01984375, -0.01984375). In the case of the row and column origins in this example, the analysis surface had a full width of 0.04 in the X and Y dimensions with 128 x 128 pixels. The lower left pixel center (as you look at the chart) was therefore located at -0.02 + [0.0003125 / 2] = -0.01984375 in both X and Y. Lines 7+: The data values of each pixel in the analysis grid.
|
|||||||||||||||||||||||||||||||||||||||||||||||||||||||||||||||