Luminous Intensity measures the luminous flux / steradian and should be used in place of the Intensity on a Polar Grid analysis when Photometric considerations are required or when an arbitrary detector response function is needed. The analysis requires the use of a Directional Analysis Entity (DAE) and is only valid for incoherent rays.
This command can be accessed in the following ways: •Menu > Analyses > Luminous Intensity •Toolbar button:
In its basic operation (no detector response), the Luminous Intensity calculation will only report the photometric units of Candela (lm/sr) or Arbitrary/sr when the source units are known (i.e. Watts or Lumens). If the source units are not known the Luminous Intensity calculation will still proceed by integrating the source spectral distribution with the photopic response curve and multiplying by the scale factor, but the units are not guaranteed to be Candela. Therefore when the source has units set to Unspecified, the only available option in the Luminous Intensity calculation will be "Arbitrary (not all source power units are known)". These units can be interpreted as arbitrary photometric units.
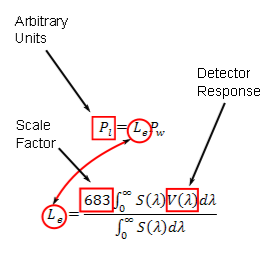
When the source units are specified (i.e. Watts or Lumens), the Luminous Intensity calculation allows a user specified detector response function to be used rather than the standard photopic response curve and luminous efficacy value. In terms of the conversion to photometric units, the detector response function has the following application:
In this case we are not necessarily integrating with the photopic response curve or setting the appropriate scaling factor and so the resulting units are not necessarily photometric units. The end units are therefore arbitrary but not guaranteed to be arbitrary photometric.
It is therefore possible to recover photometric units in a Luminous Intensity calculation by two methods:
The Polar axis will always correspond to an axis passing through the poles of a globe-like sphere. Thus, for symmetric values of the polar angle range, 0° corresponds to a direction passing through the equator. For example, with the polar axis set to X and the azimuthal axis set to Z, the axis of symmetry is the Z axis.
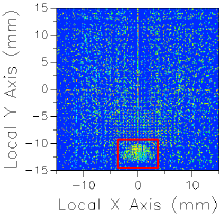
Image Artifact Diagnostic Tool If a raytrace has been performed using the Advanced Raytrace option with ray paths enabled, contributing raypath information for a particular region of interest can be reported directly from the chart view for an incoherent spatial analysis or analyses using a Directional Analysis Entity. This feature can be executed by holding down the ALT keyboard button while using the mouse to select a region of the main chart view (turn of "perspective view" using the right mouse button menu option). This procedure is outlined in the following example:
The image artifact diagnostic tool will print the following information to the output window: •Analysis surface used •Selected region x-min, x-max, y-min and y-max •Path number, path power and ray count for each contributing ray path (up to the first 30 paths, sorted by power) •Remaining path count and total power for paths not listed in the output window
LuminousIntensityToARN (script command) LuminousIntensityToFileDAE (script command)
|
||||||||||||||||||||||||||||||||||||||||||||||||||||||||||||||||||||||||||||||||