|
Description
The Intensity on Polar Grid function calculates flux/steradian (Intensity) for rays filtered by a Directional Analysis Entity (DAE), indicating the radiant power flowing into the solid angle subtended by each bin of the DAE. NOTE: this analysis is only valid for incoherent rays.
Rays included in the resulting distribution are subject to the following:
|
1.
|
The ray must meet the ray selection criteria applied to the DAE.
|
|
2.
|
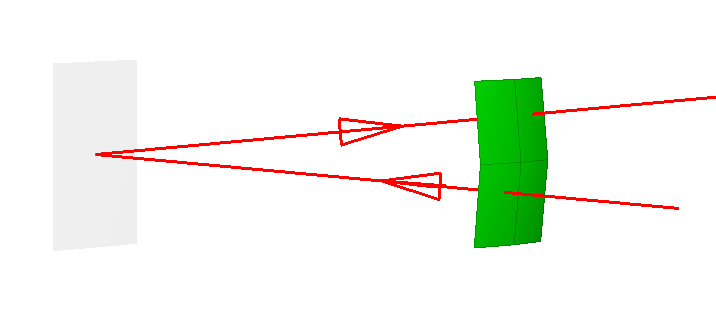
The ray must have a propagation direction lying within the directional boundaries of a pixel on the DAE (i.e. the binning of the rays is performed in angle space). In the graphic below, there are two rays whose trajectories pass through the origin of a DAE. The angular region of interest is indicated by the four green pixels on the right hand side of the graphic. In this configuration, the ray emitting from the origin, propagating to the right of the image and passing through the top right pixel of the DAE would contribute to the resulting Intensity for that pixel (power is flowing in that pixel's subtended direction). The ray which is propagating from right to left and passing through the origin would NOT contribute to the resulting Intensity for the pixel on the lower left of the DAE, since the flow of this ray's energy is opposite in direction to the angle subtended by the corresponding pixel with respect to the origin of the DAE (this ray's power is not flowing into that pixels subtended direction).
|
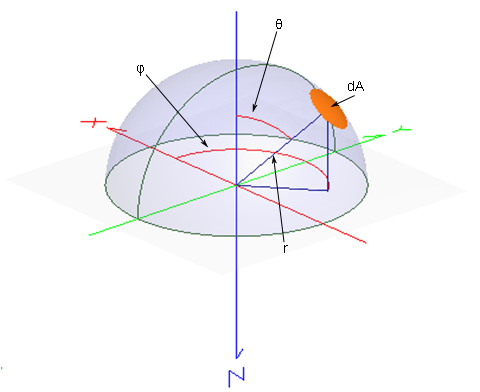
Intensity has units of power/steradian (W/sr, in SI units). Using the following diagram, we define Intensity mathematically as:
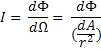
where F is the power, W is the solid angle and r is the distance between the source and the area dA, as indicated below.
In general, it is advisable to use the Intensity on Polar Grid analysis in place of the Intensity Spread Function analysis. The Intensity Spread Function analysis uses approximate formulas which can introduce errors in the computed intensity for large values of q.
Navigation
This command can be accessed in the following ways:
•Menu > Analyses > Intensity on Polar Grid
•Toolbar Button: 
Controls
|
Control
|
Inputs / Description
|
Defaults
|
|
Use This Directional Analysis Entity
|
|
Use This Directional Analysis Entity
|
Lists the DAE used to filter the rays in the intensity calculation.
|
Selected DAE
|
|
List of Available Directional Analysis Entities
|
|
List of Directional Analysis Entities
|
Lists the available DAEs for use as the ray filter.
|
First DAE in list
|
|
Pre-Analysis Ray Operations
|
|
Delete old rays and recreate all active sources
|
If checked, existing rays are deleted, and new rays are created before the analysis proceeds.
|
Unchecked if rays exist. Checked if no rays exist.
|
|
Raytrace all active rays
|
If checked, any existing rays are raytraced before the analysis is performed.
|
Unchecked if rays exist. Checked if no rays exist.
|
|
Plot the rays as they are being raytraced
|
If checked the rays will be drawn to the 3D view when traced.
|
Unchecked
|
|
Post-Analysis Operations
|
|
Create Analysis Results Node (ARN)
|
Adds an Analysis Results Node (ARN) to the Analysis Results folder on the object tree. The ARN being created stores the results of, and information about, the analysis being performed.
|
Unchecked
|
|
Name Prefix
|
The name of the ARN on the tree will be formed by combining this name prefix with an automatically generated numeric value, ensuring that the resulting ARN has a unique name string.
|
IntensityPolarGrid
|
|
|
|
OK
|
Perform analysis and close dialog box.
|
|
|
Cancel
|
Discard analysis and close dialog box.
|
|
|
Help
|
Access this Help page.
|
|
Application Notes
The polar axis
The Polar axis will always correspond to an axis passing through the poles of a globe-like sphere. Thus, for symmetric values of the polar angle range, 0° corresponds to a direction passing through the equator. For example, with the polar axis set to X and the azimuthal axis set to Z, the axis of symmetry is the Z axis.
Image Artifact Diagnostic Tool
If a raytrace has been performed using the Advanced Raytrace option with ray paths enabled, contributing raypath information for a particular region of interest can be reported directly from the chart view for an incoherent spatial analysis or analyses using a Directional Analysis Entity. This feature can be executed by holding down the ALT keyboard button while using the mouse to select a region of the main chart view (turn of "perspective view" using the right mouse button menu option). This procedure is outlined in the following example:
|
|
1.Perform an Advanced Raytrace (ray paths on).
2.Perform an incoherent spatial or directional analysis (irradiance, illuminance, color image, position spots diagram).
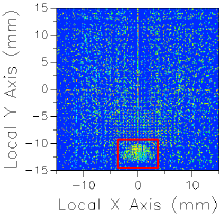
3.In the main chart view hold ALT while using the mouse to select a region of interest (shown in red).
4.Resulting path information is printed to the output window.
|
The image artifact diagnostic tool will print the following information to the output window:
•Analysis surface used
•Selected region x-min, x-max, y-min and y-max
•Path number, path power and ray count for each contributing ray path (up to the first 30 paths, sorted by power)
•Remaining path count and total power for paths not listed in the output window
Related Topics
Directional Analysis Entity
IntensityToFileDAE (script command)
Intensity Spread Function
|
Copyright © Photon Engineering, LLC
|
|