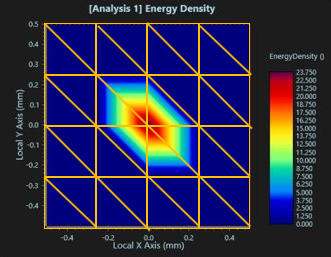
For low pixel and/or ray counts on an analysis surface or detector, the barycentric (triangular) interpolation scheme used by LightningChart can introduce a visual artifact in the form of an asymmetry which may look hexagonal or triangular. This is purely an effect of the interpolation scheme and the displayed asymmetry is not present in the underlying data.
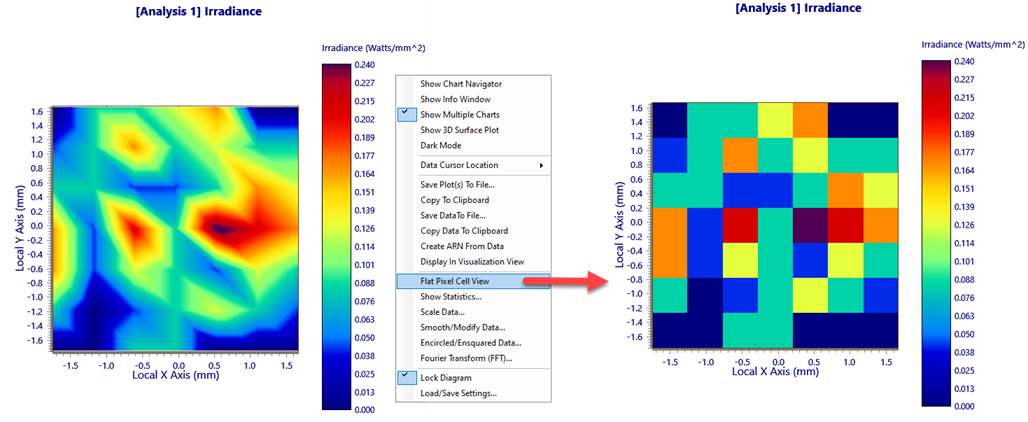
When this occurs and the interpolation is plainly incorrect, it is recommended to instead display the flat pixel cell view instead (this option is available in the R-click context menu of the chart)
The following topics pertain to the new LightningChart graphing of analyses:
LightningChart - Customizing the Chart View LightningChart - Manipulating the Chart View LightningChart - Create ARN from Data LightningChart - Copy to Clipboard LightningChart - Data Cursor Location LightningChart - Display in Visualization View LightningChart - Encircled/Ensquared Data LightningChart - Fourier Transform (FFT) LightningChart - Load/Save Settings LightningChart - Save Plot(s) to File LightningChart - Show 3D Surface Plot LightningChart - Show Chart Navigator LightningChart - Show Info Window LightningChart - Show Multiple Plots LightningChart - Smooth/Modify Data
|