|
Description
This command displays analysis plots as texture maps in FRED's 3D View at the analysis surface position.
Navigation
On the active 3D chart view, right mouse click and select "Display in Visualization View" from the list menu.
Controls
|
Control
|
Inputs / Description
|
dDefaults
|
|
Set Chart Image in 3D View
|
|
Smooth
|
Use smoothing. Applies a smoothing filter to the bitmap image displayed in the 3D view, but has no effect on the analysis data.
|
Unchecked
|
|
Semi-transparent
|
Image is semi-transparent as displayed in the 3D view.
|
Unchecked
|
|
Set Colors by Max/Min Values
|
Colors set by max/min values. This has the effect of saturating the pixels outside of the range specified by the max/min values.
|
Unchecked
|
|
Remove Chart Image from 3D View
|
|
Remove
|
If the Show in Visualization View dialog is opened for a plot already displayed in the 3D View and this option is checked then the chart will be removed from the 3D View.
|
Unchecked
|
|
|
|
OK
|
Accept settings and close dialog box.
|
|
|
Cancel
|
Discard settings and close dialog box.
|
|
|
Help
|
Access this Help page.
|
|
Application Notes
Display Example
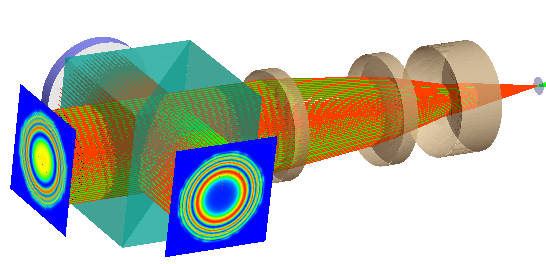
The image below shows irradiance calculations from both arms of an interferometer displayed in FRED's 3D View using the Show in Visualization View feature. The irradiance plots were calculated using two separate Analysis Surfaces. The irradiance calculation windows can be retained in the view by using the Lock Diagram option.
Display Limitations
The number of pixels that can be displayed as a texture map in the 3D view is limited by the graphics capabilities of each computer. In the event that the texture map display fails, usually only a gray surface will be displayed. Texture maps up to 1024 x 1024 pixels will typically be properly displayed. Hardware accelerated modes should allow for proper display of texture maps with larger numbers of pixels.
Related Topics
LightningChart Controls
|
Copyright © Photon Engineering, LLC
|
|