A LightningChart Diagram contains up to three basic plot types which can be customized by the user via the Diagram Properties Control; these are the 3D plot, 2D (Grid) Plot, and Line Plot types. Each plot type has their own custom settings which can be customized for a specific analysis, or when customized via the global settings area, can be saved and invoked each time the same chart type is displayed.
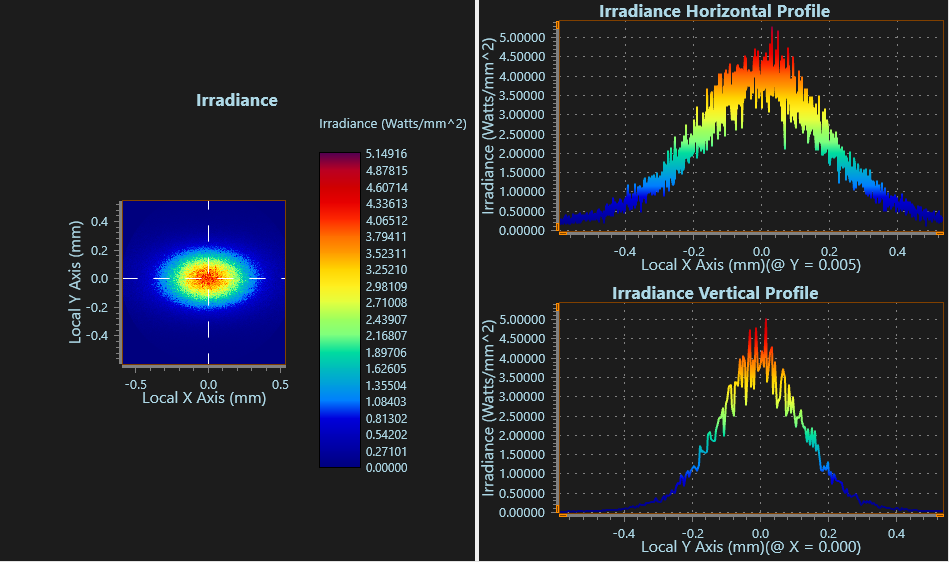
For example, an Irradiance analysis creates a LightningChart diagram containing four charts spanning all three chart types; there is one 2D (Grid) plot, one 3D plot, and two Line Plots (one for vertical, another for horizontal):
In the above image the 3D plot is not shown but is still part of the diagram (and will replace the 2D Grid when activating the option to "Show 3D Surface Plot"). Similarly, if the option to "Show Multiple Plots" is made inactive and the "t" key is pressed to cycle through the charts individually, we will see all four charts that form the diagram.
Each time a chart type is requested, the chart settings are read either from default settings files, or a previously saved XML file if specified in the Tools... Preferences... Chart tab. The default chart settings files can be changed by customizing the chart via the Diagram Properties Control as described below, and then choosing to Load/Save Settings.
The charts may be customized via the Diagram Properties Control within the Chart Navigator:
The Diagram Properties Control
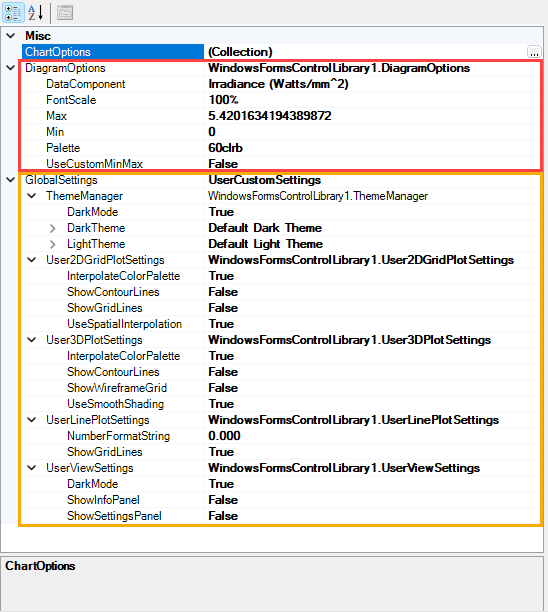
The Diagram Properties control is grouped into three areas, ChartOptions, DiagramOptions, and GlobalSettings, as discussed below. Note that only GlobalSettings are able to be saved for use with future charts.
The ChartOptions collection permits both basic and advanced changes to a given chart type for the current set of diagrams only (i.e. the changes made will only apply to the current chart and no others). Changes made via the ChartOptions cannot be saved for use with future charts. If the intention is to save the settings for general use please use the GlobalSettings instead.
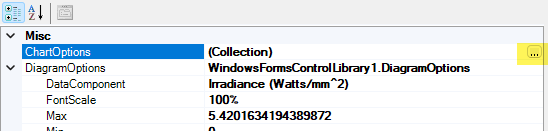
To open ChartOptions first left-click the mouse in the "(Collection)" box area, and then click the ellipses box that appears (highlighted yellow below):
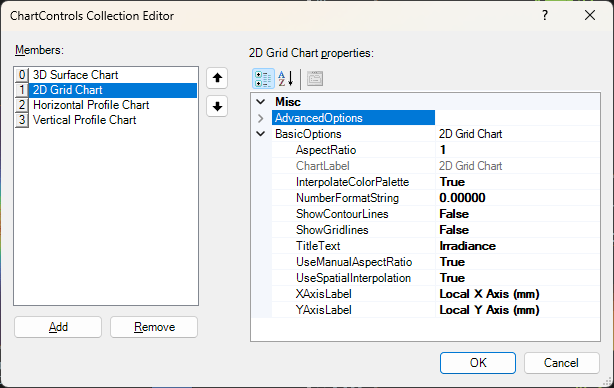
This opens the ChartControls Collection Editor:
The chart to customize can be selected on the left, and the properties available to change are on the right. These properties are given in two drop downs... a curated "BasicOptions" list, and the "AdvancedOptions" which contains every setting available within LightningCharts.
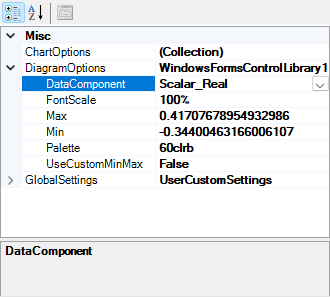
DiagramOptions contain settings that will apply to all charts within the current diagram. E.g. the font size can be increased, the color palette changed, or the max/min values customized. Note that for the max/min values to be used, the "UseCustomMinMax" option must be first set to true, and the charts will revert to their defaults if reset to false.
Where an analysis produces multiple components (e.g. Coherent Scalar Wave Field) the DiagramOptions area will feature a DataComponent drop down selection to choose the component to chart:
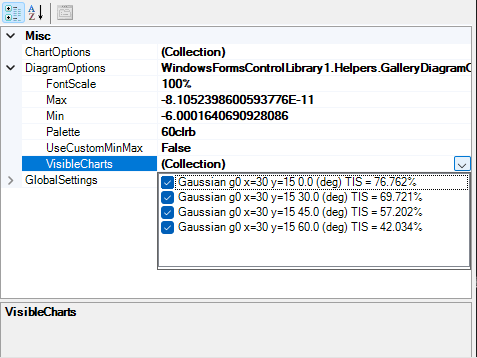
Where an analysis produces multiple charts of the same type (e.g. Scatter Plot 3D) the DiagramOptions area will feature a VisibleCharts drop down selection to choose the charts to include in the visualization:
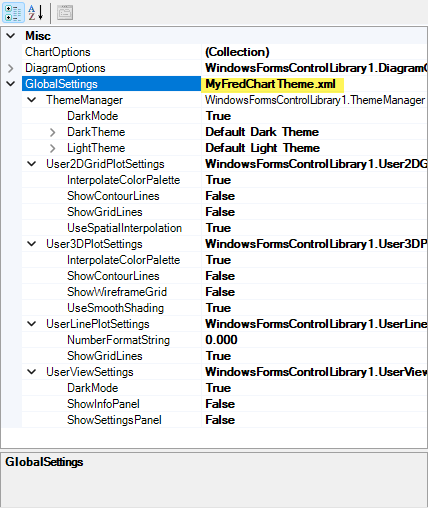
GlobalSettings provides a curated set of options that can be customized and saved to an XML file for future use. This is expected to be the most used customization area for most users. Within this area we can change the default rendering mode between Dark and Light Mode, change the Light/Dark mode color schemes, and other items concerning the three plot types.
Once changes are made to this area they can be saved (or loaded to an existing chart) or made the new system defaults via the Load/Save Settings option, in which case the name of the XML file used will be displayed next to the GlobalSettings box to inform which settings are being used.
It is currently not possible to default Charts to the 3D surface view instead of the 2D Grid view as LightningCharts is not yet set to leverage the "Initial Appearance" setting in Tools... Preference... Chart.
|