The Intensity Spread Function calculates flux/steradian (intensity) for rays filtered by a user-selected analysis surface. Incoherent, coherent, and coherent polarized rays will be incoherently summed together if filtered by the analysis plane. The intensity distribution is calculated by binning the filtered rays by solid angle as defined by the analysis surface. Note that all binning is done in direction cosine space, not in angle space. During the analysis, results are printed the the FRED output window.
NOTE: The intensity calculation is valid only for incoherent sources.
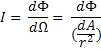
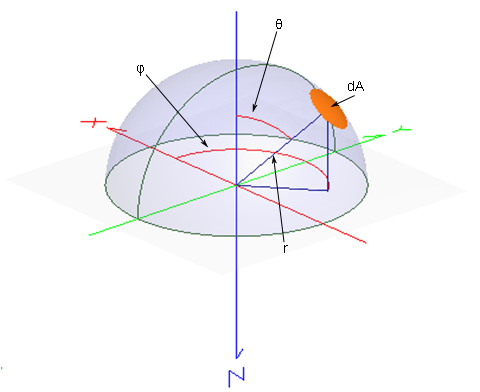
Intensity has units of power/steradian (W/sr, in SI units). Using the following diagram, we define Intensity mathematically as:
where F is the power, W is the solid angle and r is the distance between the source and the area dA.
This command can be accessed in the following ways: •Menu > Analyses > Intensity Spread Function •Ctrl + F12 •Toolbar button:
Chart crosshairs are available by holding the left mouse button down inside the plot. The intensity at the selected chart position is reported at the bottom of the chart in both xy-angles and in polar-azimuthal angles (relative to the local analysis plane X axis).
Right mouse clicking in the chart view brings up a list menu that contains the item "Move Profile Lines To". The options on the sub-menu list can be used to precisely and rapidly locate the crosshairs at common positions of interest.
Intensity (script command) IntensityToFileDAE (script command)
|
||||||||||||||||||||||||||||||||||||||||||||||||