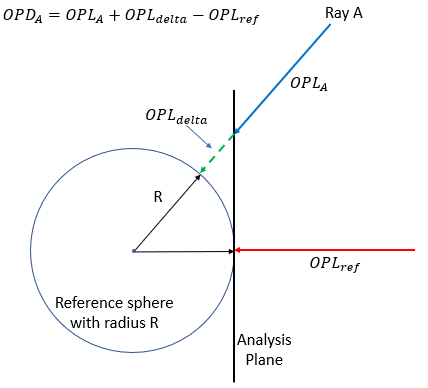
This analysis calculates an Optical Path Difference (OPD) map based upon geometric ray data and is used to evaluate the quality of the wavefront carried by a collection of rays. One OPD map will be generated for each unique wavelength in the rayset (up to 20 different wavelengths are supported). Determination of the OPD for each ray is made using the ray's optical path length (OPL), a reference sphere centered on the best focus position, and the OPL of a reference ray. In the image below, the reference sphere represents the ideal wavefront converging as a spherical wave onto the focus point. Of the rays at the analysis surface being used in the OPD calculation, the ray closest to the center of of the aperture will be treated as the "reference ray". The OPD for all rays is calculated with respect to the OPL of the reference ray. With the reference sphere and the reference ray determined, the OPD of any ray is then calculated by finding the total path length of the ray when it intersects the reference sphere (OPLA + OPLdelta in the image below) and then subtracting off the OPL of the reference ray.
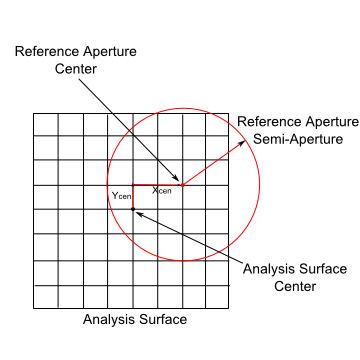
Given an analysis surface being used in the OPD Map calculation, a virtual reference aperture is specified such that rays outside of its semi-aperture are excluded from the reference sphere fitting and OPD map calculations. The reference aperture specification is shown below relative to the designated analysis surface being used in the OPD Map calculation.
This command can be accessed by selecting Analysis > Geometric OPD Map from the menu.
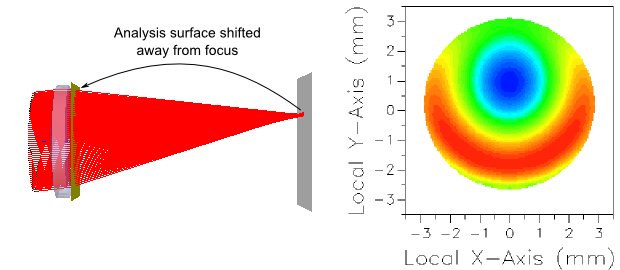
The OPD map cannot be computed at the focus of an optical system. In this case the analysis surface must be moved away from focus and the best fit sphere will be centered on the focus position, as shown in the layout below.
A good rule of thumb to use will be to place the analysis surface at the exit pupil of the optical system and match the analysis surface size to the exit pupil size. The center/focus position for calculating the reference sphere can then be specified by calculating the Geometric Best Focus in global coordinates and entering the reported X, Y and Z position values. The specification of the reference semi-aperture can then be entered as the exit pupil semi-aperture.
The Geometric OPD Map analysis prints the following information to the output window for each unique wavelength included in the analysis. •Total Rays Used •Reference Path Length •Minimum Ray Path Length •Maximum Ray Path Length •Maximum Reference Radius*
Best Focus Fit Results •Number of Rays Used •Focus Position or Tilts
*The maximum reference radius at which rays were binned (Max Ref Rad) is scaled by the reference aperture and provides an indication of how well the rays actually fill the aperture. A value significantly less than one suggests that the reference aperture is too large. NOTE: There can be OPD Map values displayed at radii beyond the maximum reference radius due to influence averaging.
The statistics of the calculation can be printed to the output window by right mouse clicking in the chart view and selecting "Print OPD Map Statistics and Info" from the list menu. The following information is printed: •Wavelength •Peak to Valley •RMS deviation from average •Approximate Strehl Ratio •Specified and Actual Fractional Influence Radius •Integer Max Influence Radius ( Frac. Influence. * # Pixels ) •Reference Aperture center and semi-aperture (in X and Y) •Max Reference Radius •# Rays Binned at Wavelength ( without regard for reference aperture ) •Reference Path Length •Reference Sphere Tilt Direction Cosines •Reference Sphere Curvature •Reference Sphere Radius •Reference Sphere Center
A separate OPD map will be calculated for each wavelength passing the ray filter criteria. Up to 20 OPD maps are supported in a single calculation.
The fractional averaging radius and blank OPD maps The fractional averaging radius is the maximum radius of influence for pixels during averaging. Values given are relative to the analysis surface width and are controlled by the slider bar. The chart control that FRED uses to display the OPD Map may fail to show cells that are entirely surrounded by "empty" cells (e.g. cells set to the "hole value"), which can result in a blank OPD Map being displayed even though some cells that have non-zero OPD values. This generally only occurs when influence averaging is disabled and can be mitigated by increasing the influence averaging range, increasing the number of rays, or decreasing the analysis surface resolution.
|
||||||||||||||||||||||||||||||||||||||||||||||||||||||||||||||||||||||||