|
Description
The Stray Light Report is a utility that allows raytrace path data to be quickly sorted and presented in a compact format based on the following path characteristics:
•The last entity along the path sequence (the Stray Light Report refers to this as the "Receiver")
•The number of scattering events along the path sequence OR the number of specular splitting events along the path sequence
Unlike the raytrace paths report, which contains a detailed listing of the entire paths database, the Stray Light Report displays only a subset of information for each path ending on the designated receiver and is intended to compactly communicate where the critical scattering or ghosting surface interactions along each path occurred. The raytrace paths report and the Stray Light Report access the same exact raypath database, but simply process and present the data in different ways.
Consider the image below, where raytrace paths of a simple optomechanical model (whose details are not important for this discussion) were recorded during an Advanced Raytrace and the resulting path data is accessed through the raytrace paths report. The raytrace paths report displays a listing of every path recorded during the raytrace and provides summary details regarding the events included in each path. While there are only 50 paths recorded in this example system, a non-trivial model can easily generate tens of thousands or even millions of paths that would be displayed in the raytrace paths dialog, all of which must be processed in order to identify the specific paths of interest for further analysis.
.png)
In the image below, the same raytrace paths data is accessed through the Stray Light Report. The settings, described in the Controls section below, are configured to display only the paths that end on the Detector Surface and have 0 scatter events. With just these two settings, the Stray Light Report has quickly filtered the paths database to the reduced set that are of interest.
.png)
When the dialog is reconfigured to show paths ending on the Detector Surface and having 2 specular splitting events, the Stray Light Report dialog appears as shown in the image below. Here, two additional columns are now displayed which indicate the two surfaces where specular splitting occurred along each path and can be seen to be Surf 1 and Surf 2 of a wedged prism element for each of the listed paths.
.png)
In addition to the basic functionality of the Stray Light Report dialog shown above, a ray selection filtering capability exists that can be used to further refine the displayed paths of interest. Although it is possible to manually search through the specific event listings for each of the paths displayed in the Stray Light Report, suppose the user wishes to identify all of the paths ending on the detector with 2 specular splitting events that also interacted with a specific surface of interest in the system. In the screenshot below, a ray selection filter has been defined with the requirement that a path must have interacted with surface "Geometry.Housing.Aperture.Notch.Surface". When this is applied to the Stray Light Report, the "Filtered Power" and "Filtered Ray Counts" columns are updated to show which paths satisfy this requirement. In this example only path 49 contains an interaction with the specified surface, as indicated by the non-zero values for "Filtered Power" and "Filtered Ray Count".
.png)
Navigation
This command can be accessed in the following ways:
•Menu > Analysis > Stray Light Report
•Menu > Tools > Reports > Stray Light Report
•Toolbar button: 
Controls
The table below describes the components of the Stray Light Report dialog. Some additional dialog capabilities are the following:
•Double click on a column header to sort the table on that quantity (double click multiple times to change the order from ascending to descending)
•Right mouse click in the table to expose a context menu containing additional options for path reports, path redrawing, and hiding/showing rows
•Left mouse clicking on the top-left (gray) cell in the table will select the entire table
|
Control
|
Inputs / Description
|
Defaults
|
|
Report Parameters
|
|
Path Type
|
Specifies which class of raypaths will be displayed in the report. In the descriptions below, N is the value specified by the Level control of the dialog. Options are:
|
Scatter paths
|
Paths containing N scatter events will be displayed.
|
|
Specular paths
|
Paths containing N specular splitting events will be displayed. The displayed paths follow the child events of the splitting interactions and contain no scatter events.
|
|
Scatter paths
|
|
Level
|
Value determining the subset of scatter paths or specular paths that will be displayed.
Example: Path Type = Scatter Paths, Level = 2
Only paths having two scattering events will be displayed.
Example: Path Type = Specular paths, Level = 2
Only paths having zero scattering events and two specular splitting events will be displayed. The displayed paths follow the child rays at the specular splitting events.
|
1
|
|
Receiver
|
Only paths ending on the specified node will be displayed.
|
|
|
Reference Power
|
Specifies the reference power number that is used to compute the "Power %" value reported in the dialog. Options are:
•Total power on the receiver
•Total scatter power on the receiver
•Total specular power on the receiver
•Power from the peak scatter path on the receiver
•Power from the peak specular path on the receiver
•Total power from the given level scatter paths on the receiver [User will provide level value]
•Total power from the given path [User will provide path number]
•The given power [User will provide power value]
If coherent rays are traced, the displayed power value will not correspond to the total power in the coherent field produced by the rays of interest (i.e. coherent properties of the rays are ignored). To recover the power for coherent rays, a field summation calculation (ex. irradiance, scalar field, vector field, etc.) must be performed. A ray selection filter can be applied to an analysis surface that will isolate the rays of interest (i.e. rays on the specified surface) and the total integrated power for those rays will be reported to the output window when the analysis is performed.
|
Total power on the receiver
|
|
Path Report Table at Level N
|
|
Column zero (blank)
|
This column contains no data but is useful for row selection in the table. Left mouse click in this column, holding the Shift key to select contiguous rows and the CTRL key to select non-contiguous rows. Left mouse clicking in the top-left blank cell will select all rows in the table.
|
|
Path Number
|
Displays the path number associated with the table row.
|
|
Filtered Power
|
Displays the total incoherent power for rays on the ray path that meet the ray selection filter requirement defined in the stray light report dialog, if one has been applied. If no ray selection filter has been applied, then the Filtered Power will be equal to the Total Power as long as all rays used during path generation are still active.
If coherent rays are traced, the displayed power value will not correspond to the total power in the coherent field produced by the rays on the path (i.e. coherent properties of the rays on the path are ignored). To recover the path power for coherent rays, a field summation calculation (ex. irradiance, scalar field, vector field, etc.) must be performed. A ray selection filter can be applied to an analysis surface that will isolate the rays on the specified path and the total integrated power for those rays will be reported to the output window when the analysis is performed.
Note: If a ray filter has been applied to the paths via the scripting command, ApplyFilterToRayPaths(), the Filtered Power and Filtered Ray Count values displayed in the GUI will be updated accordingly, though the ray selection filter displayed in the dialog is not. The ray selection filter displayed in the dialog is independent of any filter defined and applied during scripting, or elsewhere.
|
|
Filtered Power %
|
Ratio of the Filtered Power to the value specified by the Reference Power setting.
|
|
Filtered Ray Count
|
Displays the number of rays on the ray path that meet the ray selection filter requirement defined in the stray light report dialog, if one has been applied. If no ray selection filter has been applied, then the Filtered Ray Count will be equal to the Total Ray Count as long as all rays used during path generation are still active.
Note: If a ray filter has been applied to the paths via the scripting command, ApplyFilterToRayPaths(), the Filtered Power and Filtered Ray Count values displayed in the GUI will be updated accordingly, though the ray selection filter displayed in the dialog is not. The ray selection filter displayed in the dialog is independent of any filter defined and applied during scripting, or elsewhere.
|
|
Total Power
|
Displays the total incoherent power for all rays on the ray path that was recorded during raytracing. This value is static and not subject to any applied ray selection filtering operations.
If coherent rays are traced, the displayed power value will not correspond to the total power in the coherent field produced by the rays on the path (i.e. coherent properties of the rays on the path are ignored). To recover the path power for coherent rays, a field summation calculation (ex. irradiance, scalar field, vector field, etc.) must be performed. A ray selection filter can be applied to an analysis surface that will isolate the rays on the specified path and the total integrated power for those rays will be reported to the output window when the analysis is performed.
|
|
Total Power %
|
Ratio of the Total Power to the value specified by the Reference Power setting.
|
|
Total Ray Count
|
Displays the total number of rays on the ray path that was recorded during raytracing. This value is static and not subject to any applied ray selection filtering operations.
|
|
N'th surface
|
Additional columns will be added as necessary corresponding to the value specified by the Level parameter. If, for example, PathType = Scatter paths and Level = 2, two additional columns will appear in the table indicating the surfaces at which the two scatter events occurred along the path. If Path Type = Specular paths and Level = 4, four additional columns will appear in the table indicating the surfaces at which the specular splitting events occurred.
|
|
|
|
Totals
|
The last row inside of the paths table is labeled "Totals" and provides a summary of the number of paths and power values for all paths at level N.
|
|
Unfiltered summary through level N
|
Displays the total path count, ray count, and power for all paths up to level N. The intrinsic "total" values, not the filtered values, for each path are used in the accumulated values.
|
|
Ray Selection Filter (right mouse-click for popup menu)
|
|
This section of the Stray Light Report dialog allows a set of ray selection filter criteria to be defined that can be applied to the report in order to quickly process the path data in search of paths satisfying specific criteria in addition to the configured Stray Light Report requirements. In order for this capability to function, the ray data associated with the raytrace paths must exist in the ray buffer
For every ray passing the ray selection filter criteria, its power is accumulated into the "Filtered Power" value for the associated ray path and the "Filtered Count" for the associated ray path is incremented. At the end of the filtering operation, the "Filtered Power" and "Filtered Ray Count" columns show the contributions of the filtered rayset to their associated paths.
An example work flow for using the ray selection filter capability might look like the following:
1. Configure the Stray Light Report settings for path type, level, receiver, and reference power
2. Specify the desired ray selection filter criteria
3. Press the Apply Ray Filter button
4. Right mouse click in the paths table and select, "Hide all filtered paths with no rays"
5. Sort the table as desired by double clicking on the table column headers (ex. Filtered Power)
6. Right mouse click on selected paths and output path details, redraw ray history, etc.
Ray selection filtering can be removed using the following procedure:
1. Right mouse click in the ray selection filter definition and select, "Reset to Default"
2. Press the Apply Ray Filter button
|
|
Apply Ray Filter
|
When pressed, rays in the ray buffer are evaluated against the supplied ray selection filter criteria and the "Filtered Power" and "Filtered Ray Count" column values are updated for all paths displayed in the report.
|
|
|
|
Dismiss
|
Close the dialog box.
|
|
Help
|
Access this Help page.
|
Right mouse clicking in the Stray Light Report exposes a context menu with the following controls, each of which will operate on the currently selected paths. Contiguous rows in the table can be selected by holding down the SHIFT key while using the mouse to perform the row selection. The CTRL key can be held while using the mouse to select non-contiguous rows in the table.
|
Menu Option
|
Description
|
|
Output Path Details
|
Prints to the output window the details of the selected path(s). For each event along the selected path, the following information is displayed:
|
Event
|
Zero-indexed event number along the path sequence.
|
|
Tran/Refl
|
Indicates whether or not the event was in transmission or reflection.
|
|
Parent/Child
|
Indicates whether the event followed the parent ray or the child ray of the event interaction.
|
|
Specular/Scatter
|
Indicates whether the event was a specular or scatter interaction.
|
|
Sequen/NonSeq
|
Indicates whether the event occurred when raytracing in the sequential or non-sequential mode.
|
|
Diffract Order
|
Specifies the the non-zero diffraction order that occurred if the event was with a grating surface. Non-diffracting surfaces will list the diffraction order for the event as 0.
|
|
Entity
|
Object with which the event interaction occurred.
|
|
|
Output Path Summaries
|
Prints to the output window a summary of the event information for each path as well as the intrinsic total path power.
|
|
Output Stray Light Report
|
Prints the Stray Light Report configuration settings to the output window along with the Stray Light Report column data for each of the selected rows in the table.
This option is useful as a way to route the stray light report to the FRED output window for transfer to another program for analysis or documentation.
|
|
|
|
Redraw Ray History
|
Redraws all rays on the the selected path(s) to the 3D view. The "Create/use ray history file" option in the Advanced Raytrace must have been selected when the path table was generated in order for this option to be active. This option ignores the ray selection filtering capability of the Stray Light Report dialog. Rays must be active in the ray buffer in order to be redrawn.
|
|
Redraw Every N'th Ray in History
|
Opens a dialog that allows the user to enter how many rays of all rays on the selected path should be drawn in the 3D view. This option ignores the ray selection filtering capability of the Stray Light Report dialog.
This option is useful when the selected path contains so many rays that redrawing all of them would make it difficult to visually assess the raytrace path in the 3D view. The "Create/use ray history file" option in the Advanced Raytrace must have been selected when the path table was generated in order for this option to be active. Rays must be active in the ray buffer in order to be redrawn.
|
|
Redraw Filtered Ray History
|
Redraws to the 3D view only those rays on the selected path(s) which satisfy the ray selection filter criteria applied to the Stray Light Report dialog. Rays must be active in the ray buffer in order to be redrawn.
|
|
|
|
Copy to User-Defined Path List
|
Adds the selected path(s) to the User-defined path list.
|
|
Isolate Surfaces in Highlighted Paths
|
Isolates all surfaces of the selected raytrace paths in the 3D view. Note that this isolation is independent of raytrace path redrawing.
|
|
Hide all filtered paths with no rays
|
When selected, any row in the table whose "Filtered Ray Count" value is zero will be hidden from view in the Stray Light Report table.
This option is useful after a ray selection filter operation has been applied to the Stray Light Report table. The resulting paths with zero filtered rays satisfying the applied ray selection filter can be quickly hidden by selecting this option.
|
|
|
|
Hide Row(s)
|
Hides selected row(s) or group of rows in the raytrace paths table.
Note: The number of visible and hidden rows is reported in text above the top header row of the paths table.
|
|
Hide Column(s)
|
Hides selected column(s) or group of columns in the raytrace paths table.
|
|
Show Row(s)
|
Shows only the selected row(s) or group of row in the raytrace paths table (non selected rows become hidden).
Note: The number of visible and hidden rows is reported in text above the top header row of the paths table.
|
|
Show All Rows
|
Restores all hidden row(s) in the raytrace paths table.
|
|
Show All Columns
|
Restores all hidden column(s) in the raytrace paths table.
|
Application Notes
Path Filtering and Advanced Raytrace Ray Filtering
The Advanced Raytrace allows for rays to be deleted or deactivated using a customizable ray selection filter immediately following the conclusion of the Advanced Raytrace. The accumulation and tabulation of raytrace path data occurs during the raytrace and, consequently, any ray filtering applied on the Advanced Raytrace will not affect the total number of paths reported nor the values of the "Total Power" and "Total Raycount" columns of the Stray Light Report.
However, application of the ray filtering option on an Advanced Raytrace can affect the behavior of the "Filtered Power" and "Filtered Raycount" columns in the report. Filtering of the raytrace paths data using the ray selection criteria on the raytrace paths dialog relies on the presence of rays in the ray buffer that are associated with the paths in the report. When a ray selection filter in the Stray Light Report is specified and applied to the paths, the rays in the ray buffer are inspected to determine whether or not they satisfy the ray selection filter criteria, and then the "Filtered Power" and "Filtered Raycount" columns of the report are updated accordingly. If a ray passes the filter requirement test, its power is accumulated into the "Filtered Power" column of the ray's associated path and the "Filtered Ray Count" value is incremented by one.
In the event that a ray selection filter was applied on the Advanced Raytrace step, some rays in the ray buffer will have been deleted or removed immediately following the raytrace. As a consequence, the deleted (or inactive) rays contributions are not available for inclusion in the ray selection filtering step on the raytrace paths dialog. In this scenario, the Filtered Power and Filtered Ray Count columns will always be less than the Total Power and Total Ray Count values that were recorded during the raytrace.
Path Filtering Example - Filter Paths Through Surface
Consider the system shown below, where a tubular barrel assembly contains an uncoated, wedged glass window followed by an annular baffle vane. A small, transparent "notch" surface is embedded in the annular baffle that allows rays to pass through unobstructed. A lambertian source emits into the assembly, with rays being absorbed by the teal "detector" surface at the opposite end. In order for rays to arrive at the detector, they must either pass through the center of the annular baffle vane or through the transparent "notch" surface embedded in the annular baffle vane.
.png)
First, an Advanced Raytrace is performed with the "Determine Raypaths" and "Create/use ray history file" options toggled and the "Draw" option untoggled. This will generate the raytrace paths data during the raytrace without rendering the rays to the 3D view during the raytrace.
Next, the Stray Light Report is accessed from the Analyses menu and the dialog is configured for specular paths of level 0 and ending on the detector surface (the receiver). The resulting Stray Light Report table is shown below, displaying that four paths (0, 6, 12, and 15) satisfy the configuration of the Stray Light Report.
.png)
The Ray Selection Filter section of the Stray Light Report will be used to identify all paths that contain at least one event with the "notch" surface, where the event can be any type of interaction (transmit, reflect, diffract, etc.). Double clicking on the default "All rays" filter specification allows editing of the criteria to use the "On a path including specified surface" criterion shown below.
.png)
After defining the ray selection filter criteria, the "Apply Ray Filter" button is pressed. When the filter was applied to the Stray Light Report, the "Filtered Power" and "Filtered Ray Count" columns of all paths not meeting the specified ray filter criteria were set to zero.
.png)
The paths of interest can be selected in the table and then right mouse clicking will reveal a context menu that allows selection of options such as "Redraw Ray History" and "Output Path Details", which will operate only on the selected rows. Additionally, all rows with zeros for "Filtered Ray Count" can be hidden from the table view by selecting the "Hide All Filtered Paths With No Rays" option.
.png)
In the image below, path 12 has been redrawn in the 3D view using the Redraw Ray History option, giving visual confirmation that this path passes through the notch surface and ends on the detector.
.png)
Variations on the procedure described above, using any combination of the ray selection filter capability, allow the Stray Light Report to be refined so that the paths of real interest in the analysis can be easily identified.
Event Count vs. Intersection Count
Every ray path is defined by a series of events describing how the ray(s) associated with a ray path have propagated through the system. It may be useful to perform an advanced raytrace with ray paths enabled in order to determine how many events rays along a given path undergo for use in a ray selection criteria. Keep in mind, however, that event counts are not the same as intersection counts. When applying a ray selection criteria based on a path's event count, the intersection count (this is what the ray selection criteria use) is always one less than the event count in the path listing. Specifically, the raytrace paths count leaving the source node as an event, which is not included as part of a ray's intersection count.
Image Artifact Diagnostic Tool
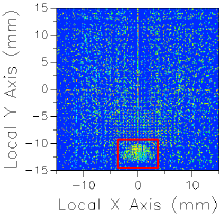
If a raytrace has been performed using the Advanced Raytrace option with ray paths enabled, contributing raypath information for a particular region of interest can be reported directly from the chart view for an incoherent spatial analysis or analyses that use a Directional Analysis Entity. This feature can be executed by holding down the ALT keyboard button while using the mouse to select a region of the main chart view (turn of "perspective view" using the right mouse button menu option). This procedure is outlined in the following example:
|
|
1.Perform an Advanced Raytrace (ray paths on).
2.Perform an incoherent spatial or directional analysis (irradiance, illuminance, color image, position spots diagram, etc.).
3.In the main chart view hold ALT while using the mouse to select a region of interest (shown in red).
4.Resulting path information is printed to the output window.
|
The image artifact diagnostic tool will print the following information to the output window:
•Analysis surface used
•Selected region x-min, x-max, y-min and y-max
•Path number, path power and ray count for each contributing ray path (up to the first 30 paths, sorted by power)
•Remaining path count and total power for paths not listed in the output window
Related Topics
Advanced Raytrace Dialog
Raytrace Paths
|
Copyright © Photon Engineering, LLC
|
|