The Color Image analysis feature calculates the XYZ chromaticity coordinates (CIE 1931) for each pixel of the selected analysis surface and then converts the chromaticity coordinates to RGB values for display in the Chart Viewer. Conversion from XYZ to RGB proceeds in the following way:
The Color Image chart view has four panes; an RGB spatial map on the analysis surface, two cross-sectional profiles, and a chromaticity diagram. As the cursor is moved in the spatial map a cursor in the chromaticity diagram indicates the XY chromaticity coordinate corresponding to the current pixel.
This command can be accessed in the following ways: •Menu > Analysis > Color Image •Toolbar button:
The data can be displayed in the chart viewer as RGB, Greyscale, Luminosity, or as one of the three RGB components by right clicking in the chart and selecting one of the following options: •Show Color (RGB) •Show Greyscale •Show Red Component •Show Green Component •Show Blue Component •Show Luminosity
Additionally, Color Image data can be written to file or read from file by right clicking in the chart and selecting Save Image (XYZ) to File or Read Image (XYZ) from File.
Color Correlated Temperature (CCT) On running this analysis the output window features an average, and weighted average Temperature value in Kelvin for Color Correlated Temperature (CCT). In the weighted average calculation each pixel is weighted by its luminance. Users should be aware that any estimate of the temperature of a particular color image is only generally accurate if the result is near the Plankian Locus. Evaluating the color temperature of a result far from the Plankian Locus should be avoided.
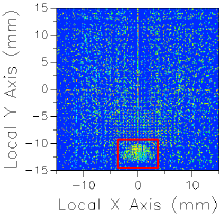
Image Artifact Diagnostic Tool If a raytrace has been performed using the Advanced Raytrace option with ray paths enabled, contributing raypath information for a particular region of interest can be reported directly from the chart view for an incoherent spatial analysis or analyses using a Directional Analysis Entity. This feature can be executed by holding down the ALT keyboard button while using the mouse to select a region of the main chart view (turn of "perspective view" using the right mouse button menu option). This procedure is outlined in the following example:
The image artifact diagnostic tool will print the following information to the output window: •Analysis surface used •Selected region x-min, x-max, y-min and y-max •Path number, path power and ray count for each contributing ray path (up to the first 30 paths, sorted by power) •Remaining path count and total power for paths not listed in the output window
ColorImage (script command) ColorImageToFile (script command) ColorImageToFileAS (script command)
|
||||||||||||||||||||||||||||||||||||||||||||||||||||||||||||||||||||||||||