The Wavelength tab of a Detailed Source allows you specification of the source wavelengths (in Air), generation method, weights, and colors.
This feature can be accessed by selecting the Wavelength tab in a Detailed Source dialog box.
Ray wavelength generation method The wavelengths of source rays can be generated by either directly specifying wavelengths in the wavelength list, randomly generating the ray wavelength according to a spectrum, or by using a spectrum to generate an evenly spaced and properly weighted set of discrete wavelengths within the requested bandwidth. Note that you cannot choose "Random according to spectrum" when the source is coherent.
Wavelength List In the case of directly specifying a wavelength list, a single ray is generated for each wavelength in the list (with non-zero weighting) at each ray position. If your source has three ray positions and there are 3 wavelengths in the list, a total of 9 rays would be generated.
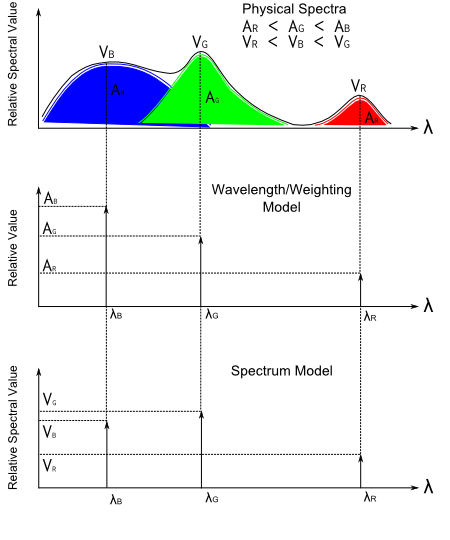
Specification of sampled wavelength weights in the wavelength list is different from specifying spectral values in a sampled Spectra node. Consider a physical spectrum as shown in the image below. When we develop a wavelength/weighting model of this spectrum, we select a discrete number of wavelengths (3 shown below) and weight them according to the relative area underneath the spectrum that each sample represents (AB, AG, AR). Note that the values selected do not necessarily represent the bandwidth limits. When we define a sampled Spectrum node, the weighting represents the sampled spectral value of the physical spectrum (VB, VG, VR). As shown below, the weights and spectral values at each of the selected wavelengths for the two approaches are not necessarily equivalent.
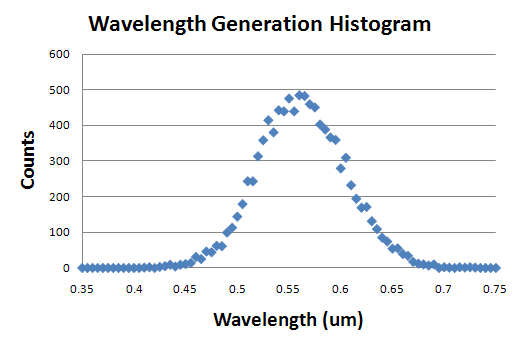
Randomly According to Spectrum When the option "Randomly according to spectrum" is used, the number of rays generated will be the number specified by the source positions/directions and the wavelengths used will be generated according to the spectral value distribution of the selected spectrum. For example, if the combination of the source ray positions and directions generates a large number of rays (say 10,000 or so) and the spectrum used for the generation is the Photopic response curve, then the histogram of the wavelengths generated by the source should have the following distribution.
Evenly-spaced, weighted according to spectrum The third option, "Evenly-spaced, weighted according to spectrum" is a hybrid of the first two options. The result of this option will be a set of discrete wavelengths evenly spaced over the requested wavelength range whose weights are properly specified to account for the extreme minimum and maximum wavelengths. Like the standard wavelength list, using this option will create N rays for each ray position/direction point in the source definition.
The wavelength range set on the Wavelengths tab has no limitations set by the spectrum being used. This means that it is possible to have wavelengths at which the wavelength range and the spectrum's definition do not overlap. In these areas no wavelengths will be generated since the spectrum values are zero everywhere outside of its definition.
Wavelength list units and weighting The wavelengths are specified in units of microns. The wavelength weights are relative to the total sum of of the weights from all wavelengths (arbitrary units). Wavelength weighting and power is given by the following relationship:
P(l) = [ Wl / Sj Wl(j) ] * Ptotal
where P(l) is the power of a given wavelength, Wl is the weight associated with each wavelength, Sj Wl(j) is the summation of all the wavelength weights and Ptotal is the total power of the source.
Wavelength specification utilities By right mouse clicking in the wavelength spreadsheet area a list menu becomes available for modification of the wavelength specifications. From the list menu it is possible to add, insert or delete wavelengths, set a wavelength range, set ray colors, synthesize a specific color from Chromaticity coordinates, Tristimulus values or an RGB value, apply visible wavelength weights, digitize spectra, read wavelength data from a text file, and plot current spectral weighting versus wavelength.
Wavelength data can be read from a properly formatted text file. The format has two header lines followed by wavelength data. The first header line must read "type wavelengths", the second header line must read "format data", and the data is entered in either two or five columns. The first two columns are wavelength and weight, the third, fourth and fifth columns are optional and hold integer RGB values (0 - 255) assigning ray draw color. The delimiter between columns may be space or tab. An example file format is shown below:
Wavelength weighting versus wavelength can be plotted by right mouse clicking in a source wavelength spreadsheet and selecting "plot" from the list menu.
As an example, the Synthesize a Color option has been used to synthesize "white" over the wavelength range 0.46-0.62 mm in 13 equal increments. After selecting "Refresh Wavelength List", "Apply Nonzero to Source" and assigning the ray draw colors using "Set All Colors From Wavelengths", we get the following plot of wavelength weighting.
|
|||||||||||||||||||||||||||||||||||||||||||||||||||||||||||||||
.png)
.png)