|
Description
The Irradiance Spread Function generates an irradiance plot using rays filtered by an analysis surface. The irradiance, in units of flux/area, is summed at the center of each pixel. In addition to producing plots, the irradiance spread function prints statistical information pertaining to the rays used in the analysis and the resulting irradiance distribution.
Navigation
This command can be accessed in the following ways:
•Menu > Analyses > Irradiance Spread Function
•Ctrl + F10
•Toolbar button: 
Controls
|
Control
|
Inputs / Description
|
Defaults
|
|
Use This Analysis Surface
|
|
Use This Analysis Surface
|
Lists the analysis surface used to filter the rays.
|
Currently selected analysis surface
|
|
List of Available Analysis Surfaces
|
|
List of Available Analysis Surfaces
|
Lists the available analysis planes for use as the ray filter.
|
All valid analysis surfaces
|
|
Pre-Analysis Ray Operations
|
|
Delete old rays and recreate all active sources
|
If checked, existing rays are deleted, and new rays are created before the analysis proceeds.
|
Unchecked if rays exist. Checked if no rays exist.
|
|
Raytrace all active rays
|
If checked, any existing rays are raytraced before the analysis is performed.
|
Unchecked if rays exist. Checked if no rays exist.
|
|
Plot the rays as they are being raytraced
|
If checked the rays will be drawn to the 3D view when traced.
|
Unchecked
|
|
Post-Analysis Operations
|
|
Create Analysis Results Node (ARN)
|
Adds an Analysis Results Node (ARN) to the Analysis Results folder on the object tree. The ARN being created stores the results of, and information about, the analysis being performed.
|
Unchecked
|
|
Name Prefix
|
The name of the ARN on the tree will be formed by combining this name prefix with an automatically generated numeric value, ensuring that the resulting ARN has a unique name string.
|
Irradiance
|
|
|
|
OK
|
Perform analysis and close dialog box.
|
|
|
Cancel
|
Discard analysis and close dialog box.
|
|
|
Help
|
Access this Help page.
|
|
Application Notes
The irradiance calculation method for coherent or incoherent sources
|
1.
|
Coherent polarized rays at each discrete wavelength are summed coherently taking into account their electric field vectors. Each coherent polarized ray’s electric field is decomposed into X, Y, and Z components and then all X components are summed coherently, all Y components are summed coherently, and all Z components are summed coherently. The X, Y, and Z components summations are then all summed incoherently. Then, all of the discrete wavelengths are summed incoherently.
|
|
2.
|
Coherent unpolarized rays are coherently summed at each discrete wavelength. Then, all of the discrete wavelengths are summed incoherently.
|
|
3.
|
Incoherent rays are summed incoherently.
|
|
4.
|
At each pixel, the results of steps 1 - 3 are incoherently summed together.
|
Diffraction effects
If the source is coherent the calculation accurately includes diffraction effects, as long as the coherent ray propagation has met the following two criteria at each surface.
|
1.
|
The individual gaussian beamlets must be significantly smaller than the diffracting apertures.
|
|
2.
|
The gaussian beamlets should be small relative to the local curvature of the optical surface.
|
The diffraction effects from apertures are calculated by sampling the aperture with gaussian beamlets. If the beamlets are not small compared to the aperture, criteria 1, then the sampling will be inaccurate. If the beamlets are large relative to local surface curvature changes, then the gaussian beamlet may not maintain its quadratic curvature upon refraction or reflection and will violate its l/4 wavefront error requirement.
If the source is incoherent, then the irradiance calculation does not include diffraction effects. The incoherent irradiance pattern is simply a binning of the incident rays into the bins or grids defined by the analysis plane.
NOTE: If the wavelengths of any two or more coherent sources differ by any amount at any decimal place, they are summed incoherently.
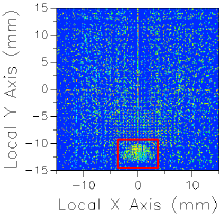
Image Artifact Diagnostic Tool
If a raytrace has been performed using the Advanced Raytrace option with ray paths enabled, contributing raypath information for a particular region of interest can be reported directly from the chart view for an incoherent spatial analysis or analyses using a Directional Analysis Entity. This feature can be executed by holding down the ALT keyboard button while using the mouse to select a region of the main chart view (turn of "perspective view" using the right mouse button menu option). This procedure is outlined in the following example:
|
|
1.Perform an Advanced Raytrace (ray paths on).
2.Perform an incoherent spatial or directional analysis (irradiance, illuminance, color image, position spots diagram).
3.In the main chart view hold ALT while using the mouse to select a region of interest (shown in red).
4.Resulting path information is printed to the output window.
|
The image artifact diagnostic tool will print the following information to the output window:
•Analysis surface used
•Selected region x-min, x-max, y-min and y-max
•Path number, path power and ray count for each contributing ray path (up to the first 30 paths, sorted by power)
•Remaining path count and total power for paths not listed in the output window
Related Topics
Chart Viewer - Chart Controls
Irradiance (script command)
IrradianceToFile (script command)
IrradianceToFileAS (script command)
|
Copyright © Photon Engineering, LLC
|
|