The directional spot diagram feature plots ray directions in direction cosine space relative to the local X and Y axes of the analysis plane, not relative to the surface associated with the rays. In addition to the ray direction plot shown in the chart view, summary information about the filtered rays is printed in the output window.
This command can be accessed in the following ways: •Menu > Analysis > Directional Spot Diagram •Ctrl + F11 •Toolbar button:
Chart crosshairs are available by holding down the left mouse button inside the direction spot diagram plot, and the plot value at the cursor position is reported at the bottom of the chart view in both direction cosines and angles. The ray directions are reported in direction cosine space relative to the analysis plane, as illustrated in the following example. Two surfaces are positioned 90 degrees to one another, an analysis plane is attached to Surf 1, while the analysis surface ray selection filter includes rays on both Surf 1 and Surf 2. Two aspects of the resulting direction spot diagram should be noted: 1) There is only a single point displayed on the diagram. This is due to the fact that all of the incoming rays are parallel and therefore have the same direction. 2) The crosshair information indicates that the rays are incident on the analysis plane X axis at 45 degrees.
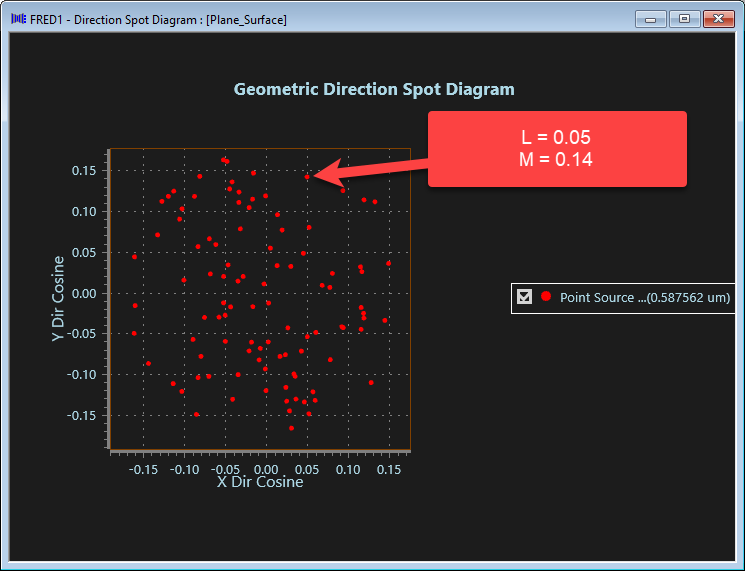
Extracting the angle to the Z-axis A common use for this analysis is to show the spread of rays around the z-axis direction of the analysis surface, and so it's often the case we wish to convert the X and Y Direction cosines of a specific point to an angle with respect to the local Z axis. To do this we use the relation that:
L^2 + M^2 + N^2 = 1
Where L, M and N are the direction cosines to the X, Y and Z-axes respectively.We then solve for N (the Z direction cosine), and take the inverse cosine to get the angle. E.g. to find the angle to Z made by the indicated ray below:
In this case: N = SQRT(1 - L^2 - M^2) = SQRT(1 - 0.05^2 - 0.14^2) = 0.988 Ang_Z = arccos(N) = arccos(0.998) = 8.5 degrees
Gaussian Ray Size Spot Diagram
|
||||||||||||||||||||||||||||||||||||||||||||||||