The Spectral Analysis feature creates a Spectrum from an existing rayset by binning the ray powers according to wavelength. Additionally, this analysis can apply the spatial (or directional) extents of an analysis surface and/or directional analysis entity as well as their additional ray selection filters when binning the rays. When the analysis has been performed, a new Spectrum node is added to the Spectra folder of the object tree.
This command can be accessed by selecting Analyses > Spectral Analysis from the menu.
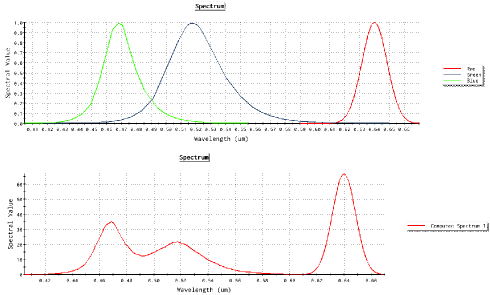
Non-uniform Wavelength Distributions Consider the following scenario; three LED's (R, G and B) are combined to provide white light illumination. This is modeled in FRED by creating three sources, each with the appropriate R, G, B spectrum and power weighting. The sources are set to generate wavelengths randomly according to a spectrum, using the individual R, G, B spectra shown on the top of the graphic below. If we create these sources (resulting in several millions of rays) and perform a spectral analysis on the resulting rayset, we get the spectrum shown on the bottom of the graphic below. This combined spectrum contains several millions of unique wavelengths by virtue of having used the "Randomly according to spectrum" wavelength generation method. Consequently, the spectral analysis mode would use the fixed bin calculation mode because we have exceeded the maximum wavelength count of 200.
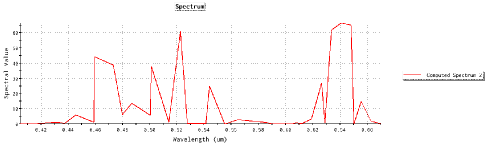
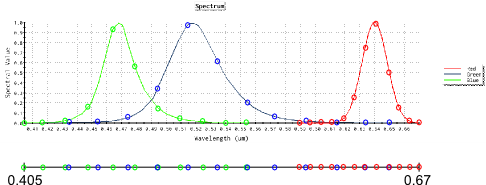
Now lets change the wavelength generation method on the three sources from "Random according to a spectrum" to "Evenly-spaced, weighted according to spectrum" and use 12 wavelengths. Each source now uses 12 discrete wavelengths evenly spaced along its spectrum. When we re-trace and re-calculate the spectral analysis, we get the following combined spectrum for the output.
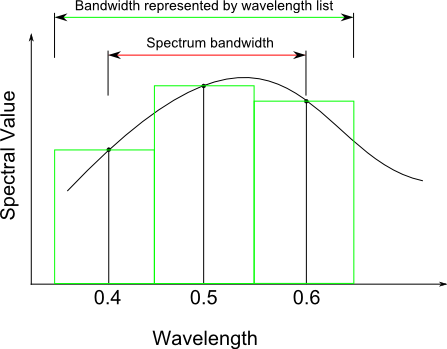
How did changing the wavelength generation mechanism on our sources lead to the spectrum shown above? The maximum wavelength sample count value in our Spectral Analysis is set to 200 samples and our sources only generated a total of 36 unique wavelengths (12 wavelengths each). So, our spectral analysis is binning the rays using the discrete sampling mode. In the discrete binning mode, the distance between adjacent samples defines the bin size for a given sample point. Although each source sampled its own spectrum using evenly spaced samples, the resulting composite spectrum shows sample points which are very non-uniform, as shown below.
As a result of this non-uniformity, the bin sizes used by the spectral analysis do not match the bin sizes which were used at the source when the wavelengths were weighted. This inconsistency causes the spectrum formed by the spectral analysis to either over-shoot or under-shoot the expected spectral value, leading to a very ragged appearing spectrum. It is important to note that on average, the spectrum will still be accurate and the area underneath the spectrum will be correct.
|
|||||||||||||||||||||||||||||||||||||||||||||||||||