This dialog generates IES output. The intensity is calculated at directions on a polar grid according to the specified photometry type and written to a file in ANSI/IESNA LM-63-2002 format.
This command can be accessed by selecting Analysis > Generate IES Output from the menu.
The intensity calculation at a given direction is performed by binning rays with propagation directions within the specified cone half-angle of that given direction. The total flux collected along a direction is then divided by the solid angle that the acceptance cone subtends to give the intensity in that direction. One advantage of this approach is that each direction bin subtends the same solid angle, potentially giving more even statistics than an approach where the bin size varies with direction (e.g., polar grid bins).
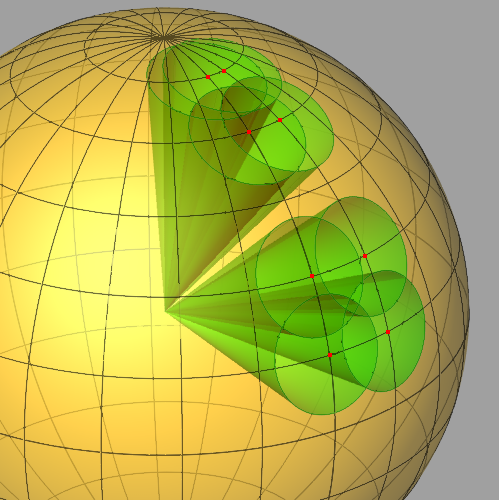
If the cone half-angle is large enough, acceptance cones for adjacent polar direction samples can overlap and result in rays being collected in more than one direction bin. The intensity calculation will still be correct, but the adjacent intensity values will not be fully independent. By default, the cone size is chosen to be just large enough to ensure overlap of adjacent polar directions at the equator. While such a cone size guarantees that all rays (within the specified angular range) will be binned, it also produces a substantial overlap for directions near the poles.
To help illustrate this, the figure below shows the direction sphere with corresponding acceptance cones for directions marked by red dots.
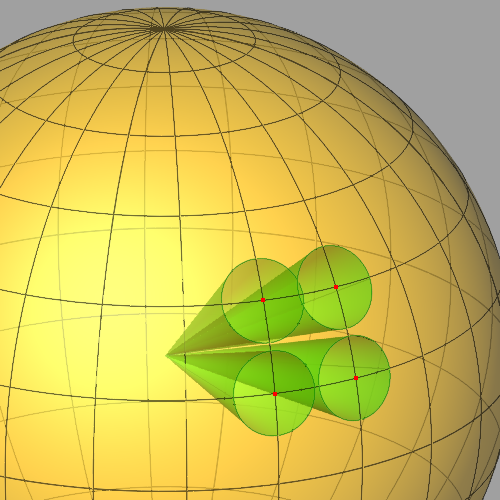
Note that for adjacent polar directions near the equator the overlap is much smaller than for the same size cones near the pole. The net effect is that adjacent intensities near the poles will vary less than those near the equator. The cone half-angle can be set so that some adjacent directions do not overlap, as illustrated below.
The intensities calculated for non-overlapping directions will be entirely independent. Rays with directions outside of all acceptance cones will simply not contribute to the calculation, and consequently the total number of rays binned may be less than the total number of rays within the angular range being calculated.
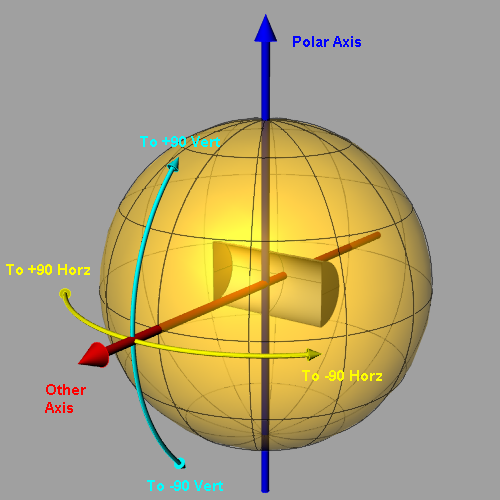
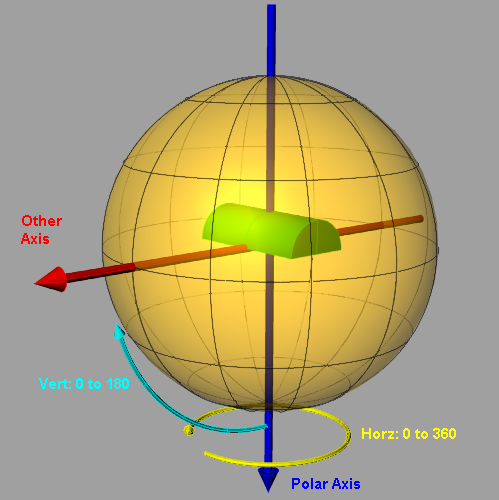
These figures illustrate how angles and the orientation of axes relative to lamp illumination direction are defined for the different photometry types. IES Type A
IES Type B
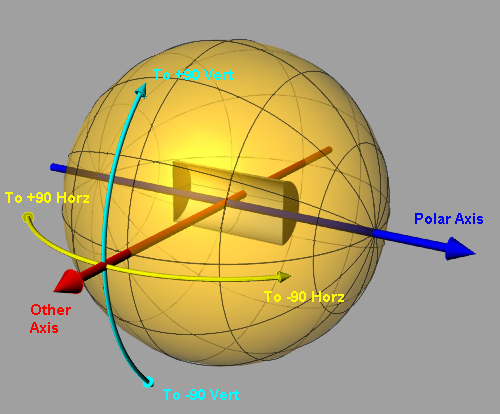
IES Type C
(Note: for Type C, the direction vector is along illumination direction.)
The ANSI/IESNA LM-63-2002 format is defined in "IESNA Standard File Format for the Electronic Transfer of Photometric Data and Related Information", LM-63-02, ISBN # 0-87995-178-8 (distributed by http://www.techstreet.com/).
Information on the coordinate systems used for the various photometry types can be found in "Goniophotometer Types and Photometric Coordinates", LM-75-01, ISBN # 0-87995-180-X (distributed by http://www.techstreet.com/).
|
||||||||||||||||||||||||||||||||||||||||||||||||||||||||||||||||||||||||||||||