FRED Optical Engineering Software is heavily driven by the graphical user interface (GUI) and the look, feel and behavior of the GUI can be customized. This help topic describes the settings available to the user for GUI customization.
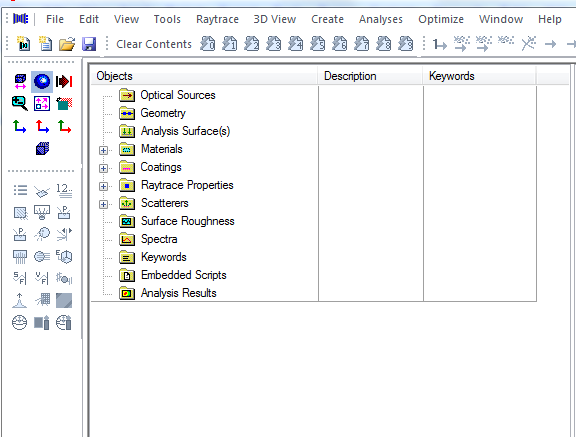
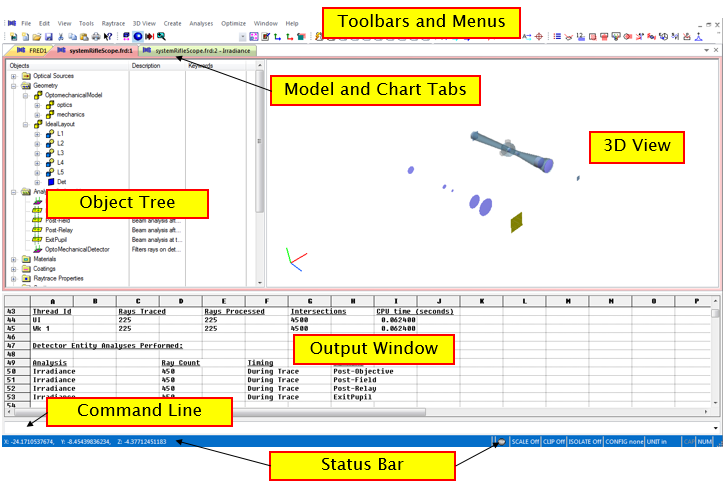
The graphic below shows the different components of the FRED GUI, some of which can be customized as described in this help topic. Each of the components is described in the following table:
The interface style options fall into two different categories: •Overall style that sets the look and feel of the toolbars, status bar, color scheme, menu shape, etc. •Document and chart tab style that controls the look, feel and behavior of the tabbed portion of the interface.
Setting of the overall style can be done by navigating to View > Style and then choosing from the various options found in the Office, Windows and Visual Studio subgroups. Some of the styles are shown in the table below.
The tabbed portion of the interface allows the user to switch between different document, chart and script tabs. Tabs do inherit certain properties from the overall interface styles shown above but also have additional style and behavior properties that can be applied. The tab specific properties are controlled by the options found in View > Style > Windows Tab.
The behavior of multiple tabs is controlled by by the three settings, No Tabs, Standard Tabs and Group Tabs. No Tabs No tabs are displayed for individual documents, charts and script windows. The user can switch among these items using one of the following methods: •Minimize the individual items using the minimize window icon found in the top right of the main FRED display and then switch between the items manually. •Select the intended item from the list found in at the bottom of the Window menu. •Tile the items using the options found on the Window menu and then select the desired item. •Switch between tabs using the accelerator keystroke CTRL+F6.
Standard Tabs Each document, chart or script window opens in its own tab and the tabs are grouped in a single row either above or below the main FRED window. An example of multiple tabs using the Standard Tab layout with tabs on the bottom is shown below. Individual tabs can be moved by dragging the tab to a new position within the tab layout. In Standard Tab mode, the individual windows of each tab can be minimized within the tab frame.
Group Tabs Group Tab mode allows the user to create different "rows" of tabs for an additional level of window organization. Unlike Standard Tab mode, however, tabs in Group Tab mode are always maximized. The sequence of images below describe how to manipulate tabs in Group Tab mode for organization.
Suppose that we start with the tabs shown below and have put FRED into Group Tab mode on the View > Style > Window Tab menu.
We want to move FRED4 and its associated script tab to a new tab group (i.e. a new row of tabs). A new tab group is created by dragging tab FRED4 into the main window. A rectangular region of the window will become outlined in grey, indicating the region that the new tab group will occupy when FRED4 is released.
On release, the new tab group will be created and it contains only FRED4.
Tabs can now be moved between groups by dragging and dropping from one to the other. Additional tab groups can be created in the same manner as described above. When moving tabs between groups, the easiest approach is to drag the tab to the far left side of an existing group and release the tab. This procedure is depicted below, where we move FRED4:Script1 into the new tab group.
Another unique behavior of the Group Tabs mode is that when the FRED icon in the Windows tray (Windows 7 shown below) is clicked, the individual tabs are displayed in mini-windows for selection. When one of these mini-windows is selected, FRED switches its view to display the corresponding tab.
A side effect of the additional Group Tabs feature set is that the performance when switching between different tabs can be slower relative to the Standard Tabs mode and is variable between computers. A common performance side effect of the Group Tabs mode will be "flickering" of the 3D view. When significant flickering is present in Group Tabs mode, the user is recommended to switch to Standard Tabs mode.
The following options modify the tab look and functionality in addition to the tab modes described above:
Tab Shape There are a number of options controlling the shape of tabs and their shading/highlighting behavior. These tab shapes are shown in the table below:
Tabs on Bottom Controls whether the tab row(s) are displayed at the top or at the bottom of the main FRED window (between the output window and toolbars).
Close Button on Tab Controls whether individual tabs have a X icon for closing the tab. When this option is not active, the following behavior applies. If a tab is minimized in Standard Tabs mode, then a windows X icon appears on the top right corner of the tab window as well as the lower right corner of the tab row. If a tab is maximized in Standard Tabs mode, then an X icon appears in the top right corner of the main FRED frame. When using Group Tabs mode, an X icon appears at the lower right of each group tab row.
Enable Auto Color When this option is enabled, every tab is automatically assigned a unique (random) color. A color border matching the tab color is placed around the tab window as well.
Horizontal Tab Scroll Controls the behavior for the scenario when so many tabs are created that they overfill the available horizontal space in the window. When the Horizontal Tab Scroll option is active, arrows allowing horizontal scrolling will appear on the lower right of the tab row. These arrows are shown below for the Standard Tab mode.
When the Horizontal Tab Scroll option is inactive, the left-right arrows are replaced with a drop-down arrow. Clicking on the drop-down arrow displays a list of the off-screen tabs, which can then be selected for display.
Enable Tab Dragging When toggled, tabs can be re-ordered and moved by standard drag and drop. When untoggled, tabs are fixed and cannot be moved.
Enable Tooltips When toggled, tooltips showing the full name of the tab will be displayed when the mouse is hovered over the tab.
Show Tab Icons When toggled, icons indicating whether the tab is a document, chart or script will be displayed on the tab.
Hide Single Tab When toggled, no tab will be displayed if there is only a single document, chart or script opened. If multiple documents, charts or script windows are open, then tabs will be displayed.
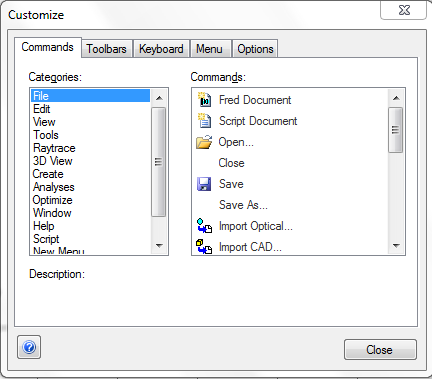
Toolbar and menu customization options are found on the View > Customize menu and the resulting dialog (below) allows control over which menus, toolbars, and toolbar buttons are visible, keyboard shortcut (accelerator keys) mappings and menu and tooltip animation behavior.
Commands The commands tab of the customization dialog is a full list of the available toolbar buttons that can be placed in your toolbars, with the various commands shown in corresponding categories. For example, the File commands include toolbar buttons for creating FRED documents, opening files, saving files, etc. Note that there is an All Commands entry in the Categories list that will show every available toolbar button in the program.
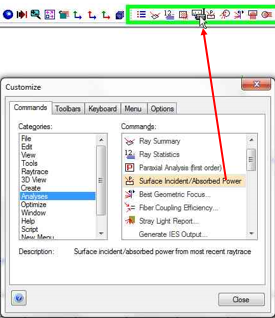
The toolbar buttons can be added by dragging and dropping the icons displayed in the commands window up to your toolbars and menus and dropping them. Similarly, toolbar buttons can be removed by dragging from your toolbars and menus back to the commands window. Shown below is the procedure for adding the 'Surface Incident/Absorbed Power' toolbar button from the Analyses category to an existing toolbar. The process for removing a toolbar button would be the reverse; drag from the toolbar down to the customization dialog.
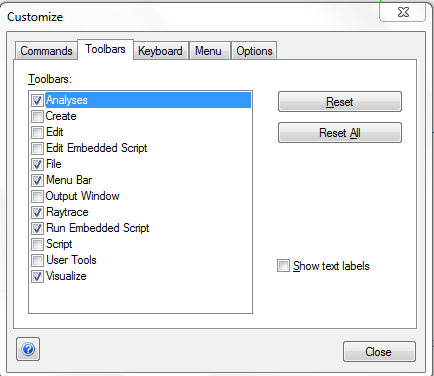
Toolbars The Toolbars tab allows you to toggle different toolbar categories active in your display. In the graphic below, only the Analyses, File, Menu Bar, Raytrace, Run Embedded Script and Visualize toolbar categories are displayed. For a selected toolbar, the reset button will reset any customization of that specific toolbar group and return the group to its initial state. The Reset All button applies the same reinitialization to all toolbar groups. The "Show text labels" option applies to the currently selected toolbar group and displays the text name of each toolbar button below the icon. Some points to keep in mind about the Toolbars:
•Individual toolbar buttons may be added and removed by dragging and dropping the icons to/from the Commands tab into the toolbars. •Toolbars may be rearranged by dragging them with your mouse in the GUI while the Customize dialog is open.
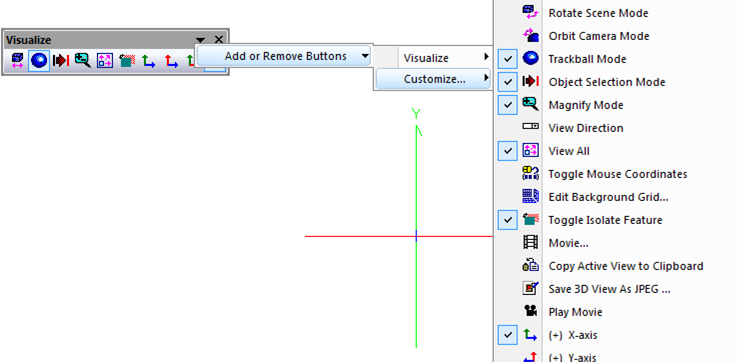
Once toolbars have been added to the interface, they can be undocked by double clicking on the far left portion of the individual toolbar group (where the three dots are). They can be re-docked by double clicking in the header area of the floating toolbar. Undocked toolbars allow additional access to add/remove toolbar buttons by using the Toolbar Options menu item (the small black triangle shown in the header of the undocked toolbar window). Navigating through the Toolbar Options menu will allow you to quickly select and deselect various toolbar buttons for display. A floating toolbar with the Toolbar Options menu open is shown below.
Since the toolbar groups can be rearranged by dragging them with your mouse (click on the three dots at the left side of each toolbar group), it is important to note that they can be docked at the top, bottom, left or right side your FRED window. For the left and right docking, however, all toolbar groups must be on the same side. Shown below is the case where the 3D view group and the analysis group are both docked on the left side of the window. The menu group can only be docked at the top of the window.
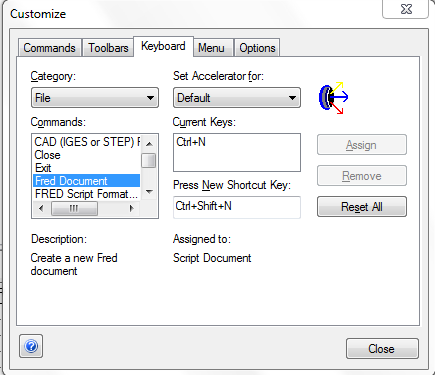
Keyboard The Keyboard tab of the Customize dialog allows remapping of the accelerator keystrokes (keyboard combinations that call specific functions). The list of commands available for use with accelerator keystrokes is found in the Commands list and the Category list can be used to filter the Commands list. When a command is selected, the Current Keys box will display the existing accelerator keystroke (if applicable). An existing accelerator keystroke can be removed by selecting the keystroke from the Current Keys list and then hitting the Remove button. A new accelerator keystroke can be defined by clicking in the "Press New Shortcut Key" box and then typing the desired keystroke on your keyboard. If the desired keystroke is already in use by another command, that will be indicated by the "Assigned to" text. If the keystroke is not already assigned, the Assign button will become active and you can press it to assign the keystroke to the selected Command.
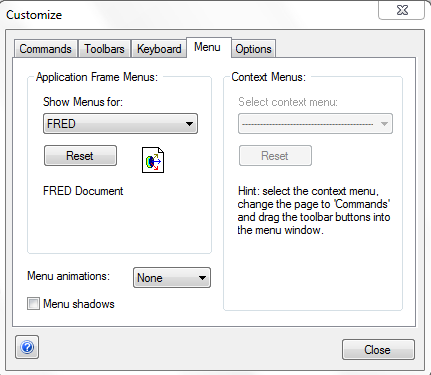
Menu The Menu tab of the Customize dialog allows for some limited customization of how menus are displayed. The options for menu customization include: •Menu animations change how the menu is animated when clicked. Options are: unfold, slide, fade and none. •Menu shadows is a toggle that allows for display of a shadow region behind a menu to provide some sense of depth. •Context menus are currently inactive.
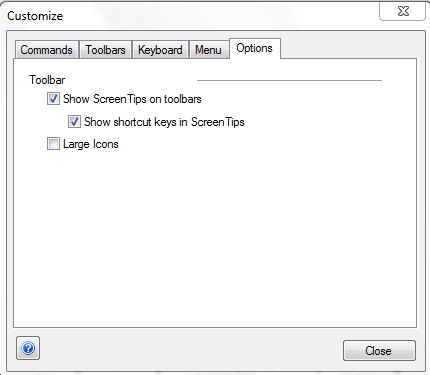
Options The Options tab of the Customize dialog has the following options: •Show Screen Tips on toolbars: Where available, hovering your mouse over a toolbar button will show a tooltip. •Show shortcut keys in Screen Tips: Where available, a tooltip will also display the accelerator key for that command. •Large Icons: Toolbar buttons are displayed in large icon mode. This may be useful for high resolution screens.
FRED's Output Window is where the program relays essential information regarding raytraces, analyses, and document modifications. There are several customizations to the Output Window that the user should consider:
Docking The Output Window can be made free floating in the main FRED window or be forced to dock to a particular location (top, bottom, left, or right). The state of docking is set by the Dock option found on the View > Output Window menu. If the user wants to dock the Output Window to a new location, the following actions should be taken:
Tabbed Output Window The Output Window can be made a tabbed item (like documents, chart windows and scripts) by right mouse clicking in the Output Window to bring up the context menu (TIP: right mouse click on the boundary of the Output Window, otherwise the context menu may not be easily displayed). From the context menu, choose the Tabbed Document option.
Auto-hide An auto-hide option allows the Output Window to be in a compact, minimized state (hidden). In this state, the Output Window becomes fully visible when activated by the mouse passing over the minimized icon labeled, "Input/Output Window". When the mouse leaves the Output Window, it returns to its hidden state. This feature can be activated by right mouse clicking in the Output Window to bring up the context menu (TIP: right mouse click on the boundary of the Output Window, otherwise the context menu may not be easily displayed) and then choosing the Auto-hide option.
Spreadsheet FRED's Output Window is actually a spreadsheet and it can be useful to view it in this way. Additionally, you can copy directly from the Output Window and paste directly into Excel. The following changes can be made to view the Output Window more directly as a spreadsheet:
Graphical User Interface Summary
|
.bmp)
.bmp)
.bmp)
.bmp)
.bmp)
.bmp)
.bmp)
.bmp)
.bmp)
.bmp)
.bmp)
.bmp)
.bmp)
.bmp)
.bmp)
.bmp)
.bmp)
.bmp)
.bmp)
.bmp)