Color Separation by Polarization This example illustrates the spatial separation of color resulting from passage through birefringent optical elements. Polarized white light is incident upon a simple lens made from calcite, a uniaxial crystal, the converging light bundle continues through a waveplate and a polarizing element, continues and is captured on a screen. At the screen, the Color Image feature is used to display the spatially distributed spectra.
The accompanying FRED document for this example, exampleColorSeparationByPolarization.frd, can be found in the <install dir>\Resources\Samples\Tutorials & Examples\ directory.
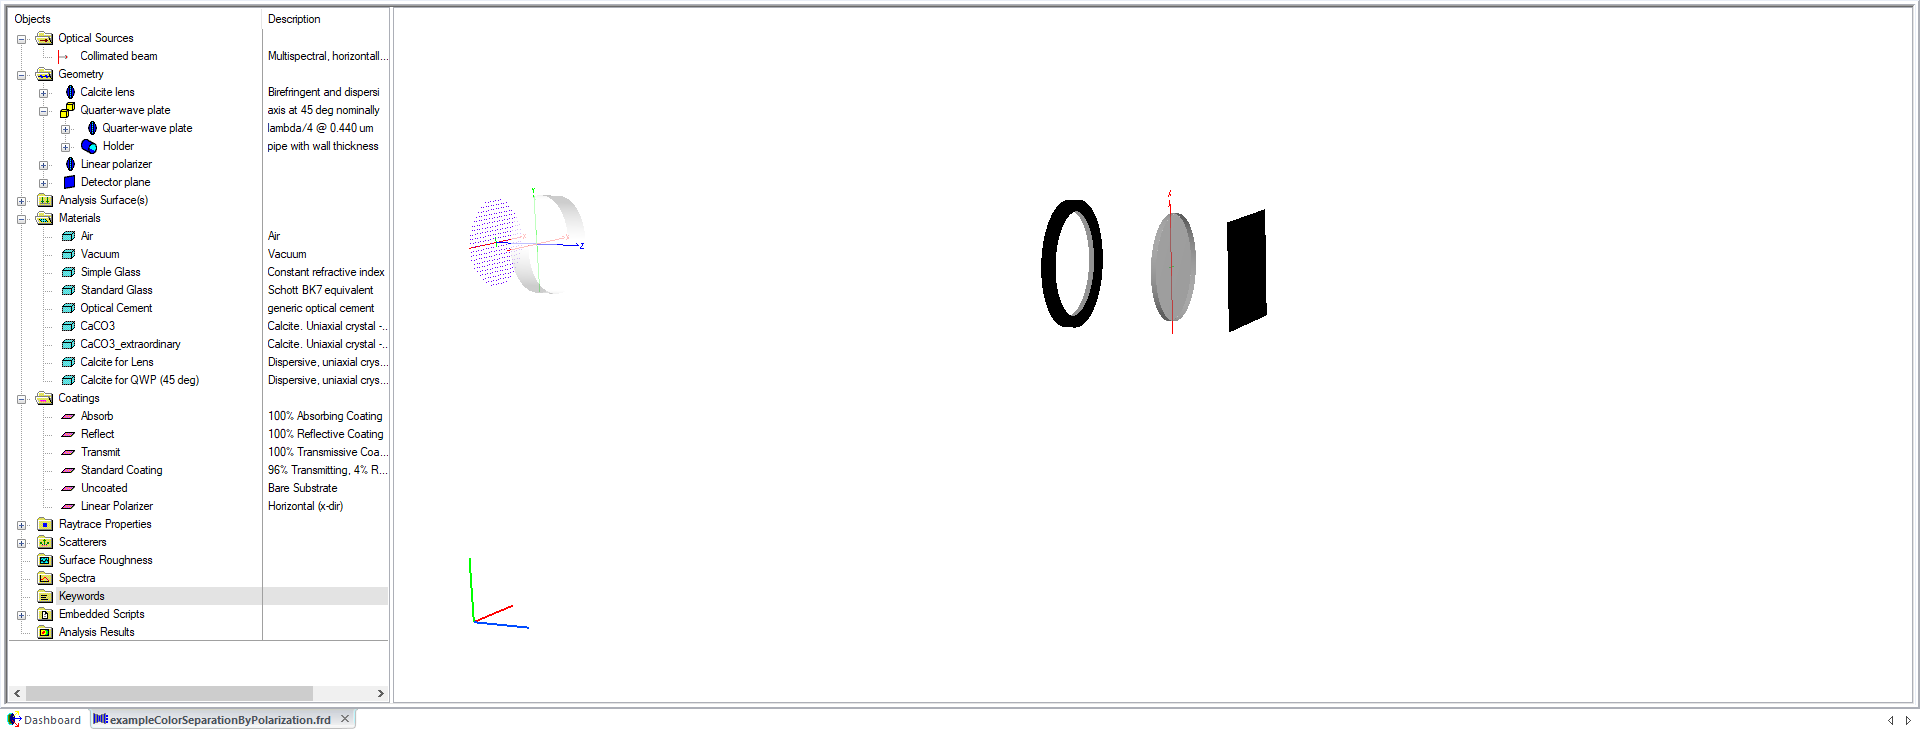
Setting up the initial geometry includes a plano-convex calcite lens followed by a calcite waveplate, a linear polarizer, and a collection plane.
Two versions of the calcite material will be defined, each with a unique crystal axis orientation. Shown below is the dialog of the calcite material definition that is used for the Lens object. Note that the Axis vector of this calcite material definition is aligned to the (0,0,1) axis, which is interpreted in the local coordinate system of the Lens node when assigned to that object.
The crystal axis of the calcite material assigned to the quarter-wave plate is oriented such that it lies 45 degrees in the x,y plane, as seen by the crystal axis vector in the material definition below. The crystal axis vector is interpreted in the local coordinate system of the object it is assigned to.
The polarizer has a coating that passes only light polarized along the global x-direction:
The source is a Plane Wave (coherent) type Source Primitive that is X-polarized.. The "Synthesize a Color" feature was used to create a range of evenly spaced wavelengths with proper weighting to simulate the color "white".
After tracing the source and analyzing the rays on the detector using the Color Image feature, the "Show in Visualization View.." option in the Chart Viewer was used to display the analysis image in the 3D View. Also, the detectors "Opacity" visualization attribute was set to "Invisible".
|
.png)
.png)
%20Edit%20Coating.png)
.png)
.png)